Generating Units Sold by Family Group Period Reports (Period Menu Mix)
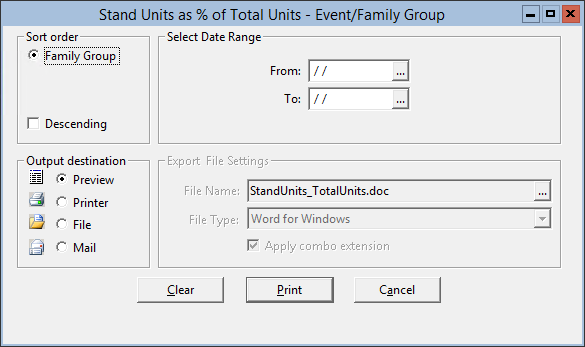
This procedure generates two reports: the Stand Units as % of Total by Family Group Report and the Family Group Total Units And Net Per Cap Report. The Stand Units as % of Total by Family Group Report shows units sold for each family group for the period that you select separated by the inventory location. This report also shows the percentage of units sold relative to the total number of units sold for each family group. The Family Group Total Units And Net Per Cap Report shows the combined total of units sold and the net per cap for each family group for the period that you select.
Figure 1-156 Generating the Units Sold by Family Group Period Report (Period Menu Mix)

Parent topic: Period Reports