
|
|
|
Home/Dashboard
The OPERA V5 Support Utility tool home or dashboard displays a series of tiles across one or more dashboard pages.
Enter or select what are you looking for from the drop-down list and click Go. This directs you to the relevant areas based on your selection.
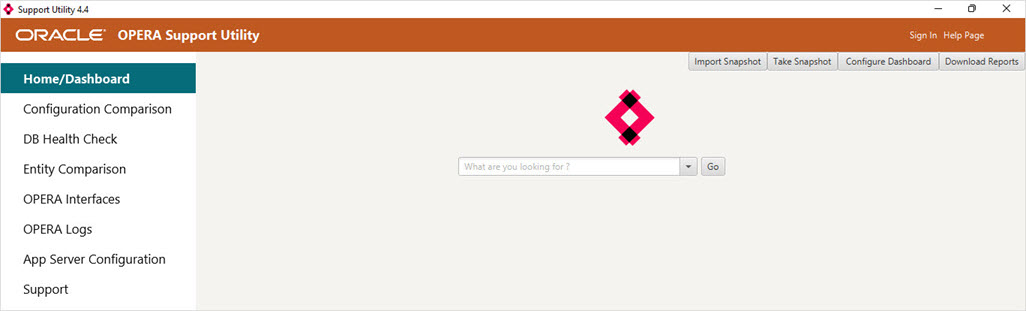
The dashboard provides you with the following options:
Allows you to import a previously created snapshot as if you were logged into that environment.
The Configure dashboard provides flexibility to customize the tiles you wish to appear on the dashboard and the individual tiles display the alerts or abnormal data associated with each individual elements such as DB Health Alerts, OPERA Health Alerts, EOD Health Alert, OPERA Printing Analyzer Alert and OPERA Interface Alerts and so on.
Click the link in the individual tile to view the detailed information on the alerts or abnormal data.

Take Snapshot: Allows you to export a snapshot of the report data from the current logged in environment. Select the reports you wish to export and click Download. It downloads all the tables relevant to that report.

Download Reports: Allows to select the dashboard elements you wish to download. Select the report and click Download to download the report and view the abnormal tables associated with the selected dashboard elements.


