Reverse Engineering of API Calls
As stated earlier, the above documentation only covers the most important features of the new REST API. With the new API Key however you have the same access to the features of Operations Monitor as with the regular web interface. So in the following section we will be using the Google Chrome browser's development tools to reverse engineer how to use API calls that are not documented here. You can also follow this guide using the Mozilla Firefox browser in conjunction with the Firebug extension. It is a fairly straightforward process though - so if you're impatient go ahead and use the web interface of Operations Monitor and watch the network activity while you're at it to figure out how to use parts of the API not covered here. For an in-depth guide how to achieve this goal please continue reading.
Note:
When watching the network activity of Operations Monitor you will often see URLs that have a weird suffix.
For example:
getSystemSettings/?_dc=1398269727192
The suffix is pretty much a timestamp appended by our frontend framework. This is done to avoid any possible caching of HTTP requests by altering the URL with the timestamp. This is done to ensure that any results are always directly from the server and not any outdated, cached results.
This scenario is very unlikely however and is merely a workaround to bad network configuration. You can go ahead and ignore this parameter when analyzing backend calls and leave the parameter out when using backend calls from a custom script.
As you might recall Operations Monitor has a feature for saving calls (you might have noticed that in many Calls related API calls you can pass a saved_id for identifying a call instead of the id and the pid). If we were to use that functionality through a script an interesting use case might be to save certain calls in the course of an operation, in order to have a human user review these later.
So let's find out, how to save calls using the new REST API. In order to walk you through the process you need to have a good understanding of how the new REST API works. If you think you might need a refresher on that please head over to the API Key and the Getting Started sections and have a quick look at our use cases Usecase Backup and Usecase High Availability.
To get started, please retrieve your API Key, and have your tools ready for action.
Next go to the Calls section in the web interface of Operations Monitor, which is shown in Figure 11-2:
Figure 11-2 The Calls Section in the Main Menu
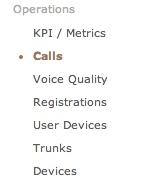
Description of "Figure 11-2 The Calls Section in the Main Menu"
Go ahead and open the developer tools so that we know what's going on in the background. Click the Customize and control Google Chrome icon to access Developer Tools as shown in Figure 11-3:
Figure 11-3 Accessing the Google Chrome Developer Tools
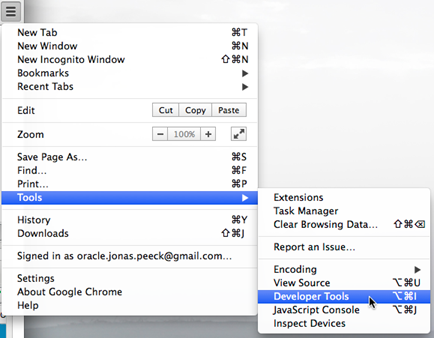
Description of "Figure 11-3 Accessing the Google Chrome Developer Tools"
Please make sure that you have the Network tab open and that recording is enabled, as shown in Figure 11-4 , so that we can observe the network activities that are happening in the background while using the web interface of Operations Monitor.
In the Recent calls section of the web interface of Operations Monitor, double click on any call to open up the call details dialog, as shown in Figure 11-5.
Figure 11-5 Double Click on a Call to See Details

Description of "Figure 11-5 Double Click on a Call to See Details"
On the bottom of the now open dialog you will find a set of buttons, including a Save button as shown in Figure 11-6. Please place your mouse cursor above that button and use it by firmly pressing your left mouse button.
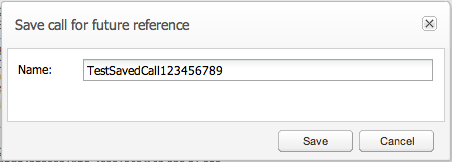
Now it's time to name the to be saved call. Please use the name TestSavedCall123456789 or a name that will be easily recognizable as your custom name as shown in Figure 11-7.
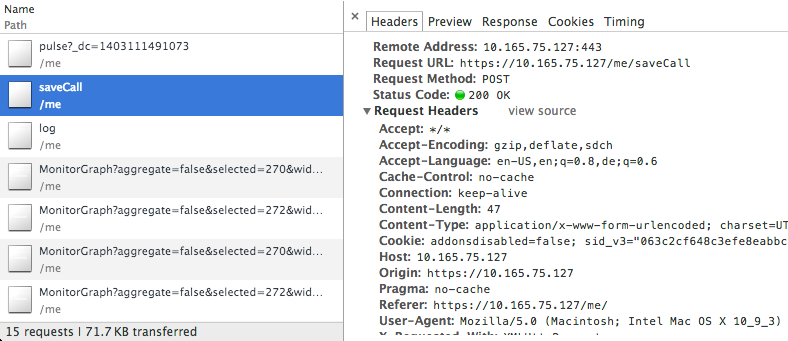
Next, if you click Save, you should see a saveCall https call popup in the network monitoring section of the developer tools as shown in Figure 11-8. You may go ahead and stop the recording of network activity at this point as we have all the info we need to find out how to use this call in the future.
Scroll down to the section Form Data as shown in Figure 11-9.
Figure 11-9 The Form Data Section of the saveCall Request
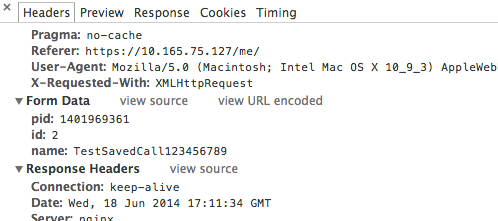
Description of "Figure 11-9 The Form Data Section of the saveCall Request"
Here we can easily read out the parameters for the saveCall request:
-
pid
The Process ID of the call we opened and saved.
-
id
The ID of the call we saved.
-
name
The name for the saved call as previously entered.
If you now switch to Preview tab of the request we can discover the returns of this call as shown in Figure 11-10:
-
saved_id
The saved_id of the call we just saved. In the future we may use this to identify this call instead of using the id and pid parameter.
-
success
This field is always part of the return if no error occurred.
And with that you now know how to save calls using the new REST API. You can use the same approach for any other functionality in the web interface of Operations Monitor that you would like to automate.
All you have to do is to play around with the web interface a bit and see how requests behave differently based on changes you perform.


