General
This section provides an introduction to the web interface, requirements, and frequently used interface elements of Operations Monitor.
Requirements
Operations Monitor runs in any major web browser without extra plug-ins or add-ons.
Note:
Operations Monitor does not require Flash, Java or Microsoft Silverlight.The following list contains the web browsers in which we regularly test the web interface:
- Internet Explorer: version 8 or higher.
- Firefox: 1.5 or higher running on any operating system (Windows, Mac, Oracle Linux).
- Safari: any version, including Safari for the iPad.
- Google Chrome: any version.
- Opera: 9 or higher running on any operating system (Windows, Mac, Oracle Linux).
In order to use the web interface of Operations Monitor, you must enable Javascript. It is recommended that you enable HTTP cookies for features such as remembering login credentials and the state of tables.
Interface Arrangement
On the left side of the Operations Monitor web user interface is the navigation pane. This navigation bar allows access to many of the features of Operations Monitor.
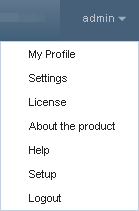
The right side of the Operations Monitor menu bar displays your username, which contains a list with following options:
- My Profile for user settings.
- Settings for administrative features.
- License for the Oracle Communications Session Monitor license terms.
- About the product for the Operations Monitor copyright information.
- Help for access to the Operations Monitor online manual.
- Setup to access the Session Monitor Platform Setup Application.
- Logout to sign out.
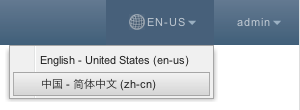
Language Selection
The right side of the Operations Monitor menu bar contains the selected language code. From the locale list, select the language to display in Operations Monitor.
Panels
When you click an element in the navigation pane, a panel appears in the center of the browser window. This panel is a user interface element that displays data.
Many panels can be added to your dashboard for at-a-glance viewing. For more information, see the Dashboard section.
To collapse panels and display titles only, you can click the up-arrow in the upper-right hand corner.
Another common user interface element is the tab panel.
Tooltips and Help
In the title bar of each panel is a gray i-symbol. This is the information box. When you hover over the information box, a question mark symbol appears and a tooltip provides a brief description of the panel. When you click the information box, the corresponding section of the user manual appears in a new browser window or tab describing the panel and its functions.
Other user interface elements support tooltips. Hovering over an element with the mouse pointer often brings up a small box explaining the element underneath.
Windows
You may encounter modal windows overlaid on the user interface, similar to the windows of your desktop environment. These windows can be dragged by their title bar, and closed by clicking on the x -symbol or pressing the ESC key. These windows also contain Help and Close buttons at the bottom. The Help button opens the online Help in a new window, describing the current page and its functionality.
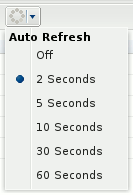
Refresh Button
Some areas of the interface contain a Refresh button that controls the update interval for the content of the page, panel, or section. It is identified by a circle of dots (flashing during refresh). Click the button once to refresh the corresponding content. It also contains a drop-down list to set the interval for the Auto Refresh.
Tables
The tables used in the Operations Monitor user interface offer some features to make the data most useful to you.
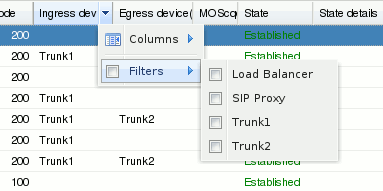
To adjust tables, hover above a column header. A down-arrow appears on the right side of the column header. To access the table menu, click the down arrow. The table menu options may differ depending on the data presented in the table.
Filters
Some tables support filters. If a table column can be filtered, the column menu contains a Filter submenu.
Below are possible options in the filters sub menu (depending on the column type):
- String Filter Filters the table to display rows that contain the entered value as a sub-string. The input value is not exclusive. This filter menu provides a text field for entering the string.
- Numeric Comparison Filter Restricts the table to rows where the comparison of the column value with the entered numeric results is 'true'. This filter menu provides three fields, one for each of the supported operators ( >, <, =). The = field cannot be used simultaneously with any of the other fields.
- Date Comparison Filter Restricts the table to rows where the column value in the selected date range. This filter menu provides three items for choosing a date ( Before, After, On). With Before and After you can select the rows where the timestamp of the column values lies before and/or after the chosen day. With On you can select the rows of only the chosen day.
- List Filter Restricts the table to rows where the column values contains the selected value. This filter menu provides a list of possible values, which you can choose by selecting or deselecting the corresponding check box.
You can choose to hide certain columns in each table. Every column drop-down menu contains a Columns submenu that lists all available columns for this table. Select or deselect the check box to the left of each entry to show or hide the corresponding column.
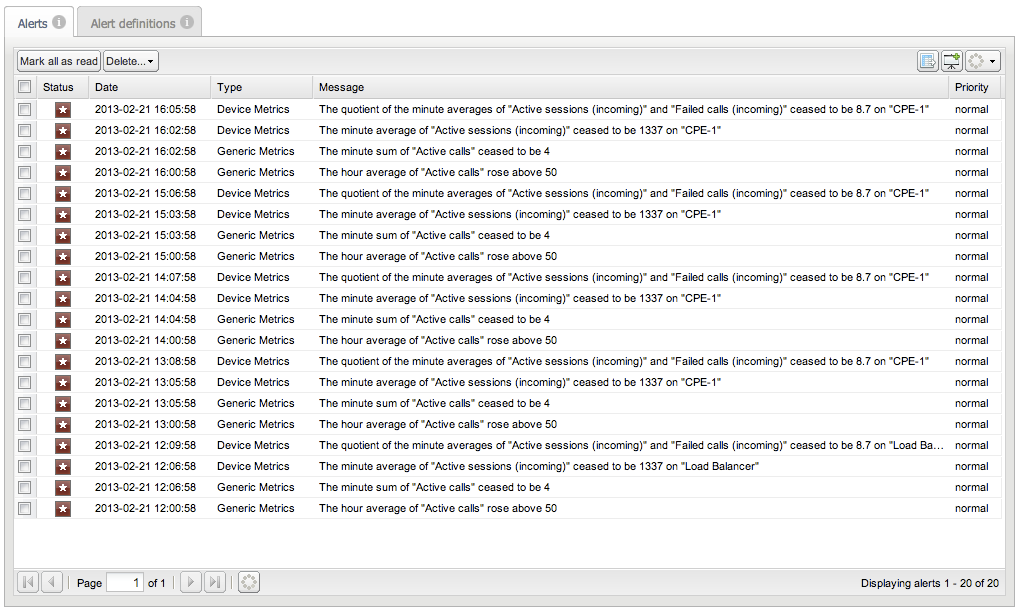
Note the paging toolbar at the bottom of tables. The presence of this toolbar means that the table offers page-wise access to its data. The paging toolbar displays the total number of pages, and to the right, the total number of items in the table.

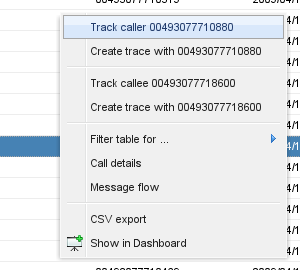
Quick User Inspection
Tables such as Recent calls, Registrations, and the user table in User Devices have context menu entries to quickly trace or track a user. You can right-click on a table row to track or trace the user (in the Recent calls table, you can quickly inspect both the caller and the callee). For more information, see the Recent Calls, Registrations, and User Devices sections.
Charts
You may encounter metric charts that display values of a numeric property over a certain time span. Metric charts provide two important features:
- Adjusting the temporal resolution.
- Panning of the visible portion along the time line.
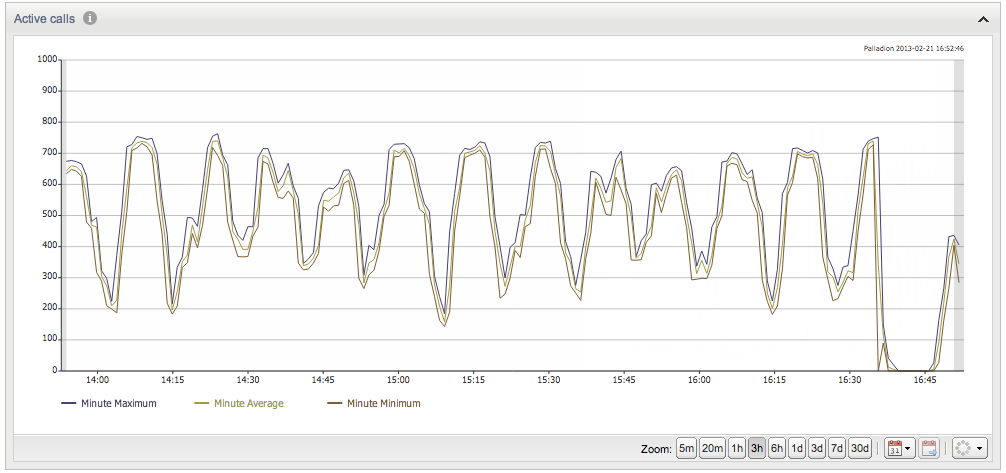
Adjusting the temporal resolution can be achieved using the Zoom buttons in the bottom-right corner of the chart. The buttons correspond to resolutions of five minutes to thirty days.
Operations Monitor's time-lined charts can be updated by clicking the Refresh button. This button also offers Automatic Refresh functionality from the button's drop-down list. For more information, see the Refresh Button section.
Panning
To pan the chart, click and drag the mouse pointer inside the chart itself. When you click the chart and drag it to the right, the visible area will be shifted further left (further in the past) on the time line. When you drag it to the left, the visible area is shifted further right (nearer to the present) on the time line. While dragging, a gray overlay indicates the direction of the chart, and how far on the spectrum you are dragging.
Note:
Panning stops the automatic refresh of a chart. Automatic refresh is re-enabled after clicking on the Go to now button at the bottom of the chart.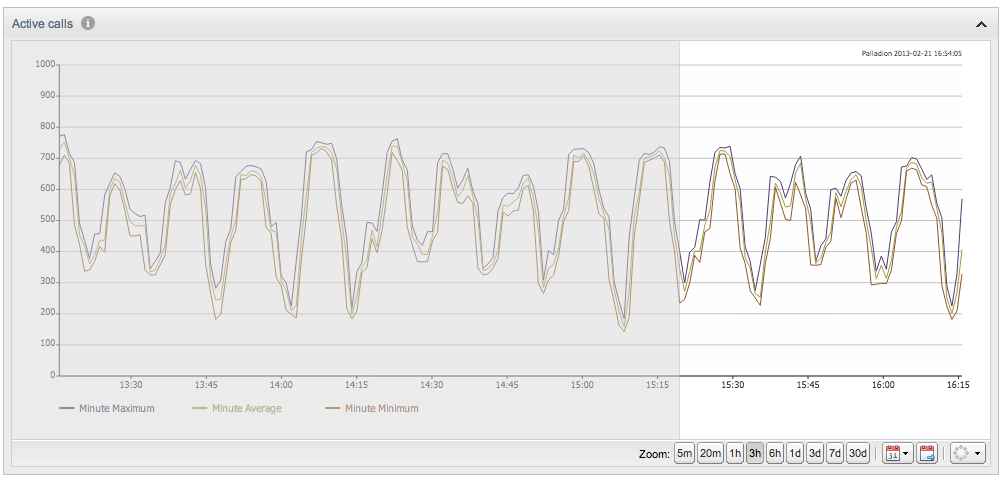
Working with Message Flows
A message flow is a diagram of a call event or a registration event. The message flow displays the network devices involved in the call event or registration event and the protocol messages that have been exchanged between the network devices. For more information on how to configure the hosts on which the network devices run, see the Platform Devices section.
Arranging Message Flows
In order to compare the network devices and protocol messages contained in multiple call events or registration events, you can open multiple message flows to view side-by-side in the same browser window, or you can open multiple message flows to view side-by-side in multiple browser windows.
To adjust the message flow window to fit in your browser screen, view a message flow in a new browser window, resize the message flow window, or view more of the message flow, do one or more of the following:
- To adjust the width of the sequence diagram within the message flow window. In the message flow window's toolbar, click the Zoom in or Zoom out icons accordingly.
- To resize the message flow window. In the message flow window's title bar, toggle between the Maximize and Minimize icon, or expand or contract the message flow window's borders.
- To view more of the message flow without resizing the message flow's window. Inside the message flow window, drag the message flow, or use the message flow window's scroll bar.
- To view the message flow in another browser window. In the message flow window's toolbar, click the Open in a new window button.
- To refresh the message flow window. In the message flow window's toolbar, click the Refresh button. For more information, see the Refresh Button section.
Customizing the Display of Contents within Message Flows
The contents displayed in the sequence diagram, protocol messages, and network devices within the message flow are customizable.
To customize the display of contents within message flows:
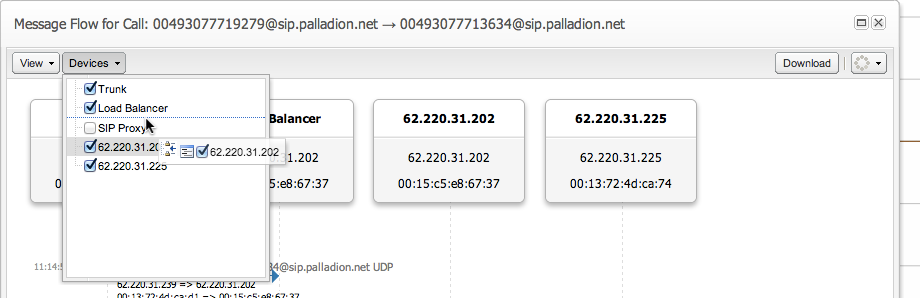
Customizing the Visibility and Position of Network Devices within Message Flows
By default, all networking devices are displayed in the message flow in the order of the call event transaction or the registration event transaction. The visibility and position of a network device is customizable in a message flow.
To customize the visibility and position of network devices within message flows:
Viewing Individual Protocol Messages
Protocol messages of the sniffed packet can be viewed and saved. For more information on saving a protocol message, see "Saving a Message Flow as an HTML File".
Each protocol message is numbered in brackets in the order of the call event transaction or the registration event transaction between the network devices.
To view individual protocol messages:
Note:
The maximum number of messages for a flow is limited. You can change the limit value in System Settings. For more information, see "System Settings".Viewing Call Event ISUP Protocol Messages
When a call event contains ISDN User Part (ISUP) binary content, you can view the ISUP binary content as human readable text.
To view call event ISUP protocol messages:


