Dashboard
The Dashboard is Operations Monitor's flexible entry page. It allows you to view the information at a glance that is most important to you. Reduced panels are defined for many features of Operations Monitor, and can be displayed on the Dashboard.
Types of panels that may appear on your dashboard are:
- Counter chart
- Recent calls
- Registrations
- User devices pie chart
- Voice Quality (VQ) overview chart
- Alerts
These panels come in variants. For example, you can display a Recent calls table only for call events passing through a certain platform device.
Configuring Your Personal Dashboard
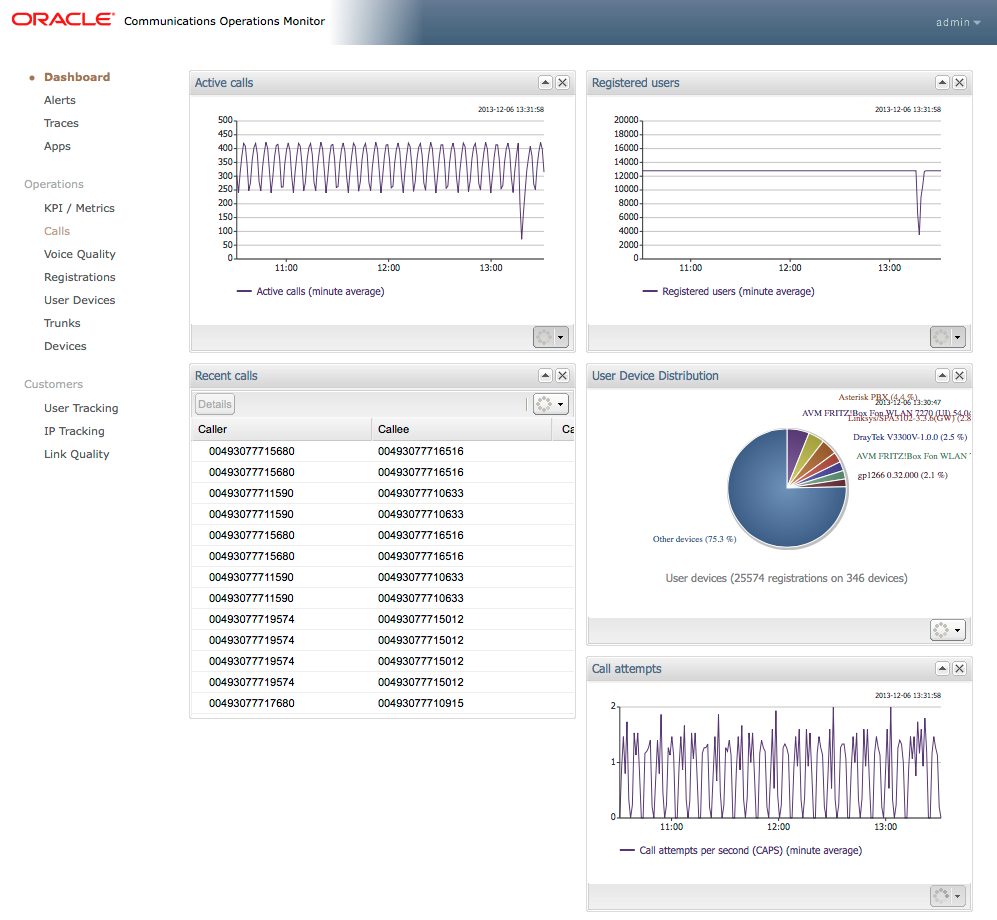
Each Operations Monitor user can define their own Dashboard layout. The default Dashboard layout contains four panels:
- Registrations Counter
- Active Calls Counter
- Recent Calls table
- User Devices Chart
Panels can be added, removed, and rearranged.
Adding a Dashboard Panel
You can add Dashboard panels from the Dashboard page or from the Operations Monitor pages, which provide information that you would like to display on the Dashboard.
To add a panel directly from the Dashboard page, right-click on the Dashboard to get a context menu, and choose Add a panel.... A pop-up window appears that provides dashboard panel options.
To add a dashboard panel from another window in Operations Monitor, click the Show in Dashboard icon (shown in following figure). This button is located throughout the Operations Monitor web interface. For more information, refer to the documentation sections referenced beside the dashboard panel types listed above.


