| Oracle® Retail Science Cloud Services User Guide Release 18.0.002 F17712-02 |
|

 Previous |
 Next |
This chapter describes the Offer Optimization (OO) module. In general, this chapter describes both modules that are offered: Promotions and Markdowns Cloud Service (PMO) and Offer Optimization Cloud Service (OO). Throughout the document, for the ease of describing the components, the term "Offer Optimization" will be used to refer to these two combined services. However, when referring to a specific component that is only available in one particular service, the complete service name will be used.
Offer Optimization is used to determine the optimal pricing recommendations for promotions, markdowns, or targeted offers. Promotions and markdowns are at the location level (for example, price-zone), and targeted offers consider the location and can be specific to each customer. The timing and depth of promotions, markdowns, or targeted offers are important levers for managing the inventory over the life cycle of the product.
The module can be useful in the following scenarios:
Bring inventory to the desired level, not only during the full-price selling period but also during the clearance period.
Maximize the total gross margin amount over the entire product life cycle.
Assess in-season performance.
Update recommendations each week. This facilitates decision-making based on recent data, including new sales, inventory, price levels, planned promotions. and other relevant data.
Provide targeted price recommendations at the segment-level.
This section provides information to help you understand the functionality of Offer Optimization.
For information about the administration of Offer Optimization, see Oracle Retail Science Cloud Services Administration Guide.
The following four user login roles are available and can be assigned at the time of user creation:
Pricing Analyst–main business user responsible for day-to-day pricing optimization activities. This user is responsible for working through price recommendations.
Pricing Manager (or Analytical Super User)–responsible for analytical configuration, testing, and model diagnosis.
Targeted Offer User–this user is responsible for working through the targeted price recommendations.
Buyer–user who is responsible for a department or departments, who approves or rejects the OO run, and who is responsible for the translation of data between OO and Oracle Retail Price Management (RPM) and Oracle Retail Customer Engagement (CE).
Pricing Administrator–responsible for the general system setup and configuration tasks related to the business.
Table 10-1 provides a description of the privileges. Subsequent tables describe privileges that are allowed based on the user role and the run status.
Table 10-1 Privileges
| Privilege | Description |
|---|---|
|
Create new OO run |
Set up and execute optimizations. All steps on the main train can be carried out, including creating a new run via the copy run functionality. |
|
Modify the name and description of an existing OO run |
Open an existing run and modify the name and description of that run. |
|
Modify the General Rule of an existing OO run |
Ability to modify the General Rule for that run. |
|
Modify the Custom Rule of an existing OO run |
Ability to modify or specify the Custom Rule for that run. |
|
View existing OO run |
Open an existing run and visit any step in the main train. The user can view data and search/aggregate/filter but cannot change anything. |
|
Optimize an OO run |
Optimize a new or modified run or a failed run. |
|
Submit OO runs |
Approve run results. |
|
Modify Promotion or Markdown Recommendations |
Ability to accept, reject, or override promotion or markdown price recommendations for that run. |
|
Modify Targeted Recommendations |
Ability to accept, reject, or override targeted recommendations for that run. |
|
Delete saved runs |
Delete run setup information and results from the database. |
Table 10-2 User Roles and Permissions
| Privilege | Data Access | Analyst | Buyer | Administrator | Analytical Superuser | Targeted Offer User |
|---|---|---|---|---|---|---|
|
Create new OO run |
All runs |
X |
X |
|||
|
View existing OO run |
All runs |
X |
X |
|||
|
Modify the name and description of an existing OO run. |
Runs they created |
X |
X |
X |
X |
|
|
Modify the General Rules of an existing OO run |
Runs they created |
X |
X |
|||
|
Batch runs |
X |
|||||
|
Modify the Custom Rules of an existing OO run |
Runs they created or batch runs |
X |
||||
|
Optimize or re-optimize OO run |
Runs they created |
X |
X |
|||
|
All runs with technical failures |
X |
|||||
|
Modify Promotion or Markdown Recommendation |
Runs they created or batch runs |
X |
X |
|||
|
Modify Targeted Recommendations |
Runs they created or batch runs |
X |
||||
|
Recalculate OO run |
Runs they created or batch runs |
X |
||||
|
Review OO runs |
Runs they created or batch runs |
X |
X |
|||
|
Submit OO runs |
All runs |
X |
||||
|
Delete saved OO runs |
Runs they created |
X |
X |
|||
|
All runs |
X |
Table 10-3 Run Status Constraints
| Role | Privilege | Object | Status |
|---|---|---|---|
|
Users |
cannot modify existing OO run |
when run is |
running or submitted |
|
Users |
cannot optimize OO runs |
when run is |
running, submitted, or not autorun |
|
Users |
cannot optimize OO runs |
unless run is |
reviewed |
|
Users |
cannot delete saved OO runs |
when run is |
running or submitted |
|
Administrator |
cannot delete saved OO runs |
when run is |
submitted |
|
Users |
cannot optimize batch runs |
when run is |
any status |
The OO user interface, at a high level, consists of the following:
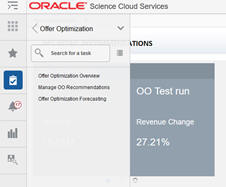
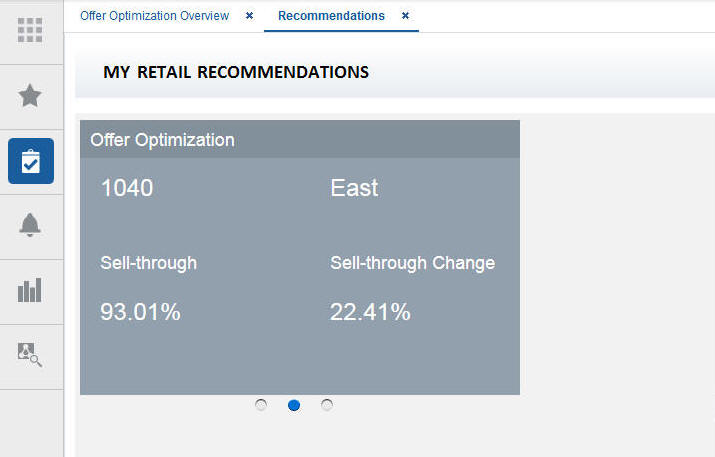
My Retail Recommendations Tab. When you log into the application, this tab provides a quick view of the latest run that has completed optimization. If you subscribe to other ORASE applications, then the corresponding tiles for each application are shown. The Offer Optimization tile consists of a link to the Offer Optimization Overview screen and the last completed run (that is, the run that is in Ready for Review status) information. This tile provides three cards that show the absolute numbers and percentage change compared to the current price policy for revenue, sell-through, and gross margin. The user can click Offer Optimization to navigate to the Overview tab. Alternatively, the user can click the Run ID or Run Name to open the run tab, which opens the Results screen.
Figure 10-1 My Retail Recommendations Tab
Task Pane. Located on the left side of the application. Use this to navigate between the applications.
Offer Optimization Overview Tab. You can access run management in this screen.
Offer Optimization Run Tab. The main tab for application work such as setting up the business rules, optimizing a run, or viewing and editing the results. There are three main steps in this tab: Setup, Rules, and Results.
Contextual BI information. This tab is located on the right side of the application. It provides information in graphical format that can be used in setting up runs and interpret the optimization results.
Oracle Digital Assistant (or Chatbot). This tab is located on the right side of the application. This functionality provides the user with voice or conversation-based assistance. The user can ask the chatbot queries (see "Integration with Oracle Digital Assistant") and Offer Optimization provides answers.
The following icons are used in user interface. Certain icons have slightly different definitions, depending on the context.
Table 10-4 Icons
| Icon | Description |
|---|---|
|
|
Copy a run. |
|
|
Create. Create a row. Create a run. |
|
|
Detach |
|
|
Delete. The object deleted depends on the context. |
|
|
Edit. Change status. |
|
|
Embedded help. |
|
|
Export to Excel. Export all. |
|
|
Freeze. |
|
|
Go to top. |
|
|
Go up. |
|
|
Go to bottom. |
|
|
Go down. |
|
|
Move selected item to another list. |
|
Progress indicator. The indicator changes mode when the application is processing data. |
|
|
|
Query by example. |
|
|
Refresh. |
|
|
Remove all items form list. |
|
|
Remove selected items from list. |
|
|
Required. |
|
|
Select date. |
|
|
Wrap. |
Buttons are used to perform certain actions and for navigation.
Table 10-5 Buttons
| Button | Description |
|---|---|
|
Action |
Provides access to the following actions: Save, Optimize, Re-Optimize, Reviewed, Save, Recalculate, and Submit. |
|
Back |
Used to return to the previous train stop. |
|
Cancel |
Used to close a dialog box without making a selection. |
|
Clear Selection |
Clears the selected rows list. |
|
Next |
Moves to the next train stop. |
|
Save |
Saves the existing settings. |
|
Select All |
In Business Rules - Product Groups, selects the entire set of rows displayed. |
|
Accept All |
In Results and Analysis, accepts all the price recommendations. |
The user interface has three pull-down menus that provide access to a variety of functionality.
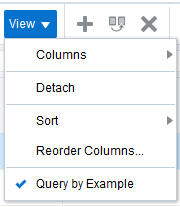
The View pull-down menu can be used to adjust how the display is organized. The options provided are:
Columns provide the ability to manage columns. You can choose to hide certain columns from display. Or you can re-order how the columns are shown.
Detach a table from the interface. This maximizes the table to fit your browser.
Sort provides the ability to specify up to three columns to sort the data in ascending or descending order for each column.
Reorder Columns provides the ability to specify the order for the columns displayed.
Query by Example can be turned off or on by unchecking or checking. This is the top row of empty text boxes that is shown over any table by default. The user can filter the display based on specified values for each column.
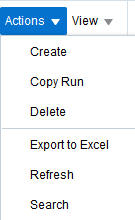
The Actions pull-down menu provides functionality that you use to manipulate the application data. Some of the following functionality is also provided by the icons described in Table 10-4.
Table 10-6 Actions Pull-Down Menu Functionality
| Action | Description |
|---|---|
|
Create Run |
In Overview, takes user to Optimization Setup train stop. |
|
Copy Run |
In Overview, used to create a duplicate of an existing run. |
|
Delete Run |
In Overview, used to delete a run. |
|
Export to Excel |
Used to export the set of rows displayed to Excel. |
|
Add |
In Business Rules–Product Groups, used to add data. |
|
Edit |
In Business Rules–Product Groups, used to edit data. |
|
Delete |
In Business Rules–Product Groups, used to delete data. |
|
Create |
In Fixture and Product Data, used to create. |
Certain stages have associated charts available on the right-hand side of the display that list data in a tabular format.
The process train displays the stages of Offer Optimization. The current stage is highlighted. You can also use the Back button and the Next button to move through the train.
Embedded help, which you access by clicking the Question Mark icon, provides additional information about the details required by certain fields.
OO is used to optimize a buyer's business strategy for a department by generating optimal price recommendations. The buyer has a business strategy and wants to determine when to offer a promotion, the depth of the promotion, which items to be considered as part of a promotion, and similar questions regarding markdown, keeping in mind the business rules and inventory levels. The application runs through the different price combinations, considering the gain when offering a promotion or markdown and whether to offer any customer-specific promotion (if the user subscribed to targeted offers) in an efficient manner that best achieves the optimization objective. Once the optimization is complete, the run goes into a Ready for Review status. An analyst can review the recommendations at each item-level and decide to accept, reject, or override any recommendation. Once the analyst finishes the review, the run status is changed to Reviewed. A reviewed run goes to the user with the buyer role for approval. If the buyer likes the recommendations then the buyer can change run status to Submitted. Here, Submit means that the price recommendations are sent to a price execution system such as CE or RPM. OO also provides the user with the ability to view and work on batch runs that are executed at regular interval (for example, week). Users can view and modify the recommendations and send them for approval to the buyer once the review is complete.
An optimization can be carried out at the configured processing (or run) location or a price-zone, merchandise level, and calendar level. The user has option of configuring the use of either price-zone or a node in the location hierarchy (but not both in the same instance). Once the optimization is complete, the recommendations can be generated at a lower level than the processing level (called recommendation levels for merchandise level and location or price-zone level). The location and merchandise level can be any level in the location hierarchy and merchandise hierarchy, respectively. Alternatively, price-zone can be used to define a set of stores (and/or online locations) and items. An example of a price zone is women's apparel in all university-based stores, grouped into one price-zone. The usual levels for the run are Region or Price-zone, Department, and Week, and, for the recommendation, the levels are Region or Price-zone and Style/Color. If Targeted Offers is available, then the recommendations will also be generated at the Customer-Segment level, along with location or price-zone and merchandise level. The Promotions and Markdowns are always at the location or price-zone and merchandise level.
The optimization is set up as follows:
Optimization is at done at one level below the run's merchandise level. For example, if the run merchandise level is Department, then each job is at the Class level.
Inventory is rolled to the desired recommendation merchandise level. Further, the inventory is aggregated across all the locations to the run's location level.
Price recommendations are generated at the configured recommendation level for merchandise, location or price zone, and calendar level and the customer segment level.
For example., if the run location level is Price-zone, the run merchandise level is Department, the run calendar level is Week, and the recommendation level for merchandise is Style/Color, then the recommendations are generated at the Price-zone, Style/Color, Week, and Segment (when TO) levels.
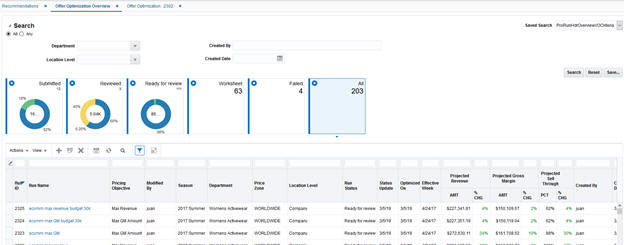
The Offer Optimization Overview is the dashboard for the OO runs. In this tab, you can see a list of all existing runs, along with details that describe each run. The list includes runs created by other users, which you can open in read-only mode. You can create a run, copy a run, open a run, or delete a run.
This screen has three components, Search, Tiles, and the Table of Runs, as shown in Figure 10-4.
The search panel is collapsed by default. You can bring up the Search panel by clicking Search under the Actions Menu. The search panel lets you filter the runs to be seen on a regular basis. It filters the run based on Department, Location, Created By, and Created Date. You can filter the runs to satisfy all the above criteria or any subset of the above criteria.
The Tiles dashboard provides quick access to information on run status. It shows the runs that are in the following status: Submitted, Reviewed, Ready for Review, Worksheet, Failed, and All. The first three tiles show how many runs are in that status, as well as a pie-chart displaying the price recommendations that have been accepted, rejected, and overridden over all the runs with that status.
The table of runs includes the columns described in Table 10-7. This provides relevant information on all the runs in a tabular format; you can perform operations such as create, copy, and delete runs in this table. For each run with a successfully completed optimization, certain KPIs such as Revenue, Gross Margin, and Sell-Through are shown in absolute numbers as well as percent gain. Note that each run can be in its own currency.
This table also provides the information about the batch runs. Batch runs are prefixed with a "Batch" in the run name, and the run status will always say "Auto run". You cannot send the batch runs to optimization. Rather, the batch runs are run at a regular frequency specified by the batch process. For example., each batch run extracts the latest sales data, updates the relevant inputs, and sends the run for optimization. If the batch run is successfully executed, the results and analysis will be shown. If not, it will not show any results and analysis. Note that the run statuses are not automatically updated; you must click Refresh to update the table.
Table 10-7 Optimization List
| Field | Description |
|---|---|
|
Run ID |
System-generated unique identifier for the run. |
|
Run Name |
The Run Name is the user-provided name. |
|
Pricing Objective |
A description of the objective used for the run. |
|
Season |
A description of the Season. |
|
Department |
A description of the Department. |
|
Price Zone |
A description of the price zone used for the run. |
|
Location |
The location selected for optimization. |
|
Run Status |
The current status of the run. Values include Worksheet, Running, Ready for Review, Reviewed, Submitted, Auto Run, and Failed. See Table 10-8 for details about each status. |
|
Status Update |
The date when the status was last updated. |
|
Created Date |
The date when the run was first created. |
|
Optimized On |
The date when the run was optimized. |
|
Effective Week |
The week ending date for which the run was executed. |
|
Created By |
Login ID of the user who created the run |
|
Projected Revenue |
Projected Revenue (AMT) for the run is the revenue generated by optimization in the run's currency, and Projected Revenue (%CHG) is the percent revenue gain compared to the current price policy. |
|
Projected Gross Margin |
Projected Gross Margin (AMT) for the run is the gross margin generated by optimization in the run's currency and Projected Gross Margin (&CHG) is the percent gross margin gain compared to the current price policy. |
|
Projected Sell Through |
Projected Sell Through (PCT) for the run is the sell-through generated by optimization, and Projected Sell Through (%CHG) is the percent gain in sell-through over the current price policy. |
Table 10-8 Run Status
| Status | Description |
|---|---|
|
Worksheet |
User is setting up the run, which has not yet been sent for optimization. |
|
Running |
The run has been sent for execution, and the process of collecting data and optimization is currently running. When the user selects re-calculate, the run enters into running status as well, but here it will be recalculating all the metrics based on the user price overrides (no re-optimization). |
|
Ready for Review |
The optimization process is complete, and the run results are ready for review. |
|
Reviewed |
The analyst finished reviewing the price recommendations and changes the run status to Reviewed so that it goes to the Buyer for approvals. |
|
Submitted |
The run results have been reviewed and approved for execution. Run results are ready for export to other applications. |
|
Auto run |
This status indicates that the run is a batch run and will be executed as part of batch process. |
|
Failed |
Run execution was aborted due to technical or data errors. |
When the run is in Ready for Review status, clicking on the run name in the overview screen will automatically take you to the Results stage.
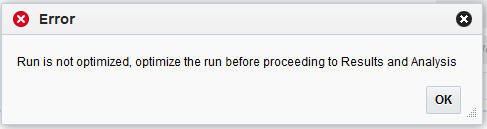
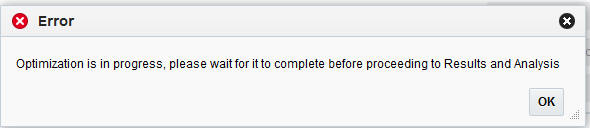
When the run is in Worksheet status, you cannot go to Results and Analysis stage since the optimization is not complete. You cannot proceed to the last stage and will see the error message shown in Figure 10-5.
When the run is in Running status, you cannot go to Results nor make any more edits. The UI is locked from further edits until the optimization is completed. If you try to go to Results, the error message shown in Figure 10-6 is displayed.
When the run is in Submitted status, you cannot accept, reject, or override any price recommendations. The UI is locked from making any further changes or edits.
To create a new run, click the Create Run icon. You are taken to the Setup stage in the Run tab.
In order to create a run, you must have either OO analyst permission or OO super user permission.
To copy an existing run, highlight that run in the displayed list and click the Copy Run icon. You are taken to the Setup stage in the Run tab. The fields are populated with copies of all inputs and data. Any existing results are not included. The list of runs is updated with a run that has a new ID. The Run Name is prefixed with "Copy Of." All other fields match the existing run.
To edit an existing run, highlight that run in the displayed list and click the run name. Any user can open a run; however, edit mode is only allowed for runs that a user created with appropriate roles and only when the run does not have a status of Running, Reviewed, or Submitted. All other runs are opened in read-only mode.
Runs can be deleted, depending on the status of the run and the permissions a specific user has. A user with Administrator permissions can delete any run except for one that has a status of Running or Submitted. Users can delete any runs they have created that do not have a status of Running, Reviewed, Submitted, or Auto run. They cannot delete runs created by another user. More than one run can be selected for deletion at the same time.
Every run is opened in an Offer Optimization Run tab, as shown in Figure 10-7. The title of the tab is Offer Optimization: <Run ID>. The Run tab opens whenever you create a new run or click an existing run. This is the main tab where you can specify the business rules and goals for the run. It provides a series of three stages that you progress through in order to set up, run, and analyze the results of the optimization run.
Setup. Used to select a season, location, and department. It is also used to select the objectives and specify the budgets.
Rules. Used to view or change business rules.
Results. Used to view results, and override, approve, or revisit prior steps in order to make changes.
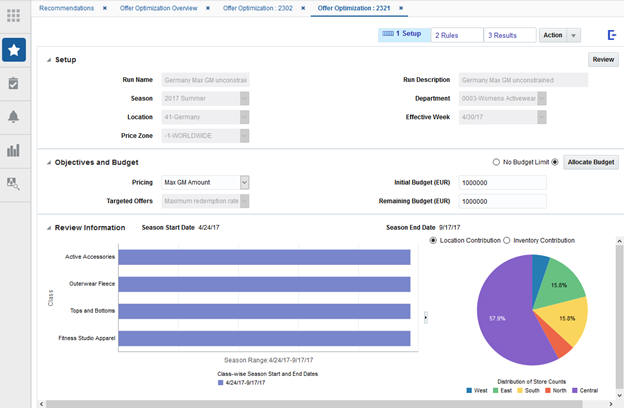
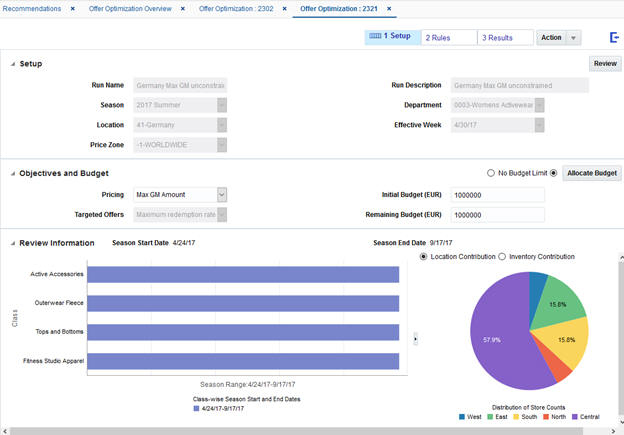
The Setup stage is used to pick a Season, Department, and Location or Prize Zone. It is organized into three major panels: the Setup section, the Objectives and Budget section, and the Review Information section.
This tab is read-only if the run has been submitted to the system, if the user does not have permission to edit runs.
You can go to the next stage only after the run is saved. Once you click Save, you can go to the next stage. If you want to send the run for optimization, click Optimize (or Re-optimize) the run for optimization. Use the Action menu to access Optimize (Re-optimize) and Save. If you send the run for optimization at this point, the default business rules are used.
The Setup section, shown in Figure 10-8, is used to select the Season, Department, Location or Price Zone, and Effective Week for the run. Click Save to save changes to the Name and Description fields. You can also use this button to save changes made in the Objectives and Budget section. You do not need to click save if you simply want to review the information for the selected season, location, department combination. You can click Review, which populates the bottom Review Information section. This is helpful if you are interested in understanding how much inventory is remaining for the selections in the Setup. However, once the run is saved, the review panel is automatically populated.
Table 10-9 Setup
| Field | Description |
|---|---|
|
Name |
The name identifying the run. The name must be 80 characters or less and use alphanumeric characters only. It is case sensitive. |
|
Description |
A brief description of the run. The value must be 200 characters or less and use alphanumeric characters only. |
|
Season |
You can choose from the drop-down list of seasons available for the run. |
|
Department |
You can choose from the drop-down list of departments available for the run. |
|
Location |
You can choose from the drop-down list of locations available for the run. |
|
Effective Week |
You can choose from the drop-down list of effective weeks available for the run. Effective weeks in the past compared to the last pull of sales data (whenever the batch process was successfully executed) are not displayed. |
This section, shown in Figure 10-8, can be used to specify the objective for Pricing and Targeted Offers problems. You can specify whether there is a Budget Limit or No Budget Limit for the Pricing problem. Four objectives are available for the user: Max Revenue, Max GM Amount, Max Revenue with Salvage, or Max GM Amount with Salvage for the pricing problem. Targeted Offers support only one objective, maximize redemption rate. You must click Save under the Action button to save any changes made in this section.
Table 10-10 Objectives and Budget
| Field | Description |
|---|---|
|
Pricing Objective |
You can choose between Max Revenue (default), Max GM Amount, Max Revenue with Salvage, and Max GM Amount with Salvage from the drop-down set of values. |
|
Targeted Offers Objective |
Supports only Maximize Redemption Rate. |
|
No Budget Limit |
Indicates no budget limit for promotions and markdowns for the run. |
|
Initial Budget |
The budget available at the beginning of the season for this department and location. |
|
Remaining Budget |
The remaining budget available at some point in the season for this department and location. For batch runs, this value is updated based on the promotions and markdowns taken so far. For a new run, this value is automatically populated with the value entered for the Initial Budget. |
|
Allocate Budget |
Use the radio button before this button to toggle to put a limit on the budget for the run. This button becomes available only when you specify a non-zero value for the Remaining Budget. When you click this button, it brings up a pop-up that you can use to specify Class-level budget limit for promotions and markdowns. |
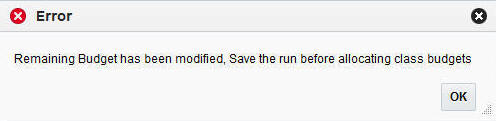
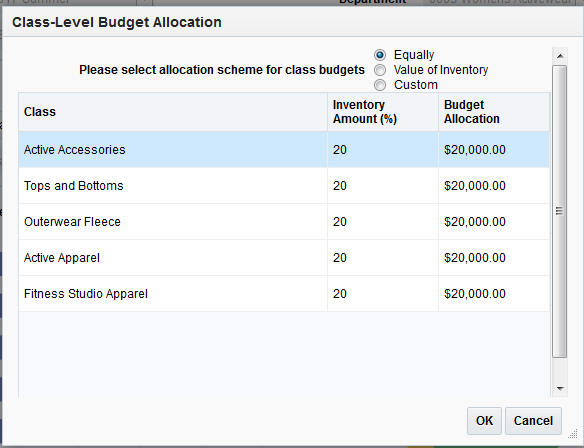
The Allocate Budget button is enabled only when you enter a non-zero value in the Remaining Budget field and save the run. If you enter a non-zero value but do not save, then selecting Allocate Budget will display the error message shown in Figure 10-9.
As shown in Figure 10-10, you can click Allocate Budget to bring up an utility that you can use to allocate the Department-level budget to classes based on three options. Equally distributes the budget equally among all classes. Value of Inventory allocates budget to each class in proportion to the value (current price * inventory) of that class. Classes with higher inventory and higher valued items receive more budget limitations. Custom allows you to specify the percent for each class. When you select this radio button, the default percentages for each class shown is based on the value of the inventory.
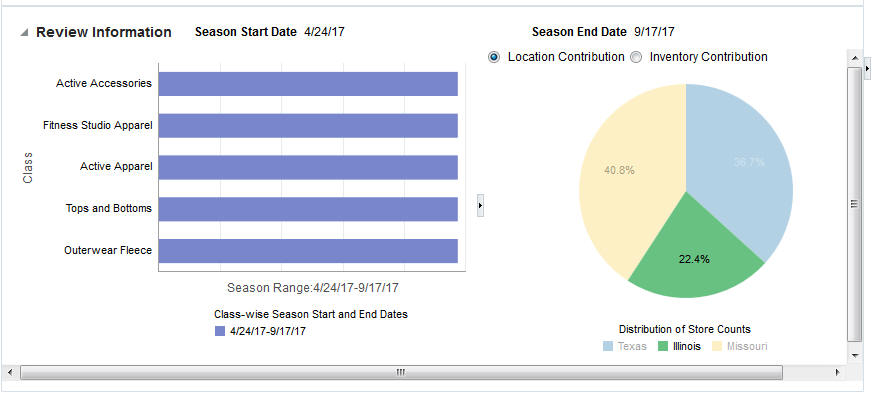
This section provides information on the start and end dates by class, a season's start and end date, and pie-charts of store counts by the immediate child location of the location selected in the setup. For example, if a region such as US Central was selected in the setup, then this displays the contribution by District (Texas, Illinois, Missouri). You can toggle between the Location Contribution pie-chart and the Inventory Contribution pie-chart. The inventory contribution shows the distribution of unsold inventory by the child location. This information is useful as it provides the status of unsold inventory at different locations.
Figure 10-11 Review Allocation Information
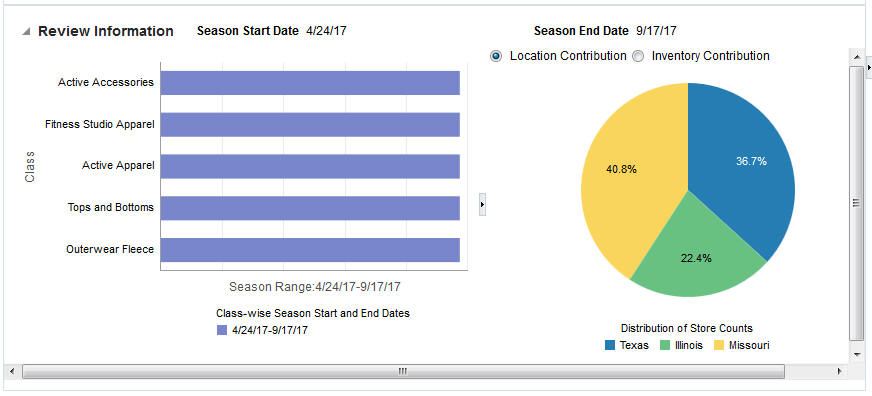
When you hover over a component in the chart, the corresponding legend item becomes highlighted. You can also hover over a legend item to see the corresponding chart component highlighted. For example, in Figure 10-12, Illinois is highlighted.
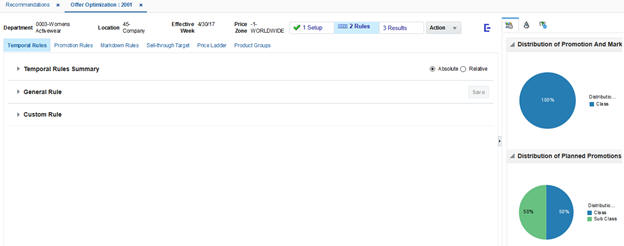
Business Rules correspond to the different constraints that are imposed on a pricing optimization problem. The Rules stage is divided into five different tabs: Temporal Rules, Promotion Rules, Markdown Rules, Sell-Through Target, Price Ladder and Product Groups. As shown in Figure 10-13, each rule screen is generally divided into three panels: Summary at the top, General Rule in the middle, and Custom Rule at the bottom. On the right, in the contextual area, the pie chart shows the percentage of rules specified at different merchandise levels.
The Summary panel displays the summary of all rules specified at different merchandise levels. By default, all rules are specified at the Class-level. When the run is saved (or optimized), the default values are used to populate at the Class-level. This panel is read-only and not editable.
In the General Rule section, you can specify the constraint at the run-level, which means that the rule is applied to all locations and all classes in the run. All classes obtain the same values mentioned in the General Rule section. The Save button is disabled if you have not made any changes in the related portion of the screen.
Custom Rule is divided into Custom Rule Selector and specific UI-related to the rule. This section can be used to modify the rule at a specific merchandise level. In the Custom Rule Selector portion, you select the merchandise level to apply the constraint.
The set of available merchandise levels shown in the drop-down list depends on the selected department in the Optimization Setup screen.
The merchandise level that can be selected is up to three levels, based on Class, Sub-class, or Style. The UI displays all the child nodes for the selected merchandise level. For example, if you select only a Class, then the child nodes that will be displayed are the subclasses for that class.
Based on the selected levels, the bottom half of the screen is dynamically populated. Custom Rules are always specified at subclass or lower levels.
The save button is disabled if you have not made any changes in the related portion of the screen.
When the rules are sent to optimization, the rules are applied based on the concept that lower-level rules override higher-level rules. That is, the rules screens allow you to manage rules by exception. Consider the following example. Suppose the General Rule says that the first min discount percent cannot be lower than 10 percent. This means that all items in all Classes are assigned this 10 percent criterion. If you decide to add a Custom Rule for a specific Style, say, 20 percent, then all the items in all Classes are assigned the 10 percent rule and the items in this particular Style are assigned the 20 percent rule.
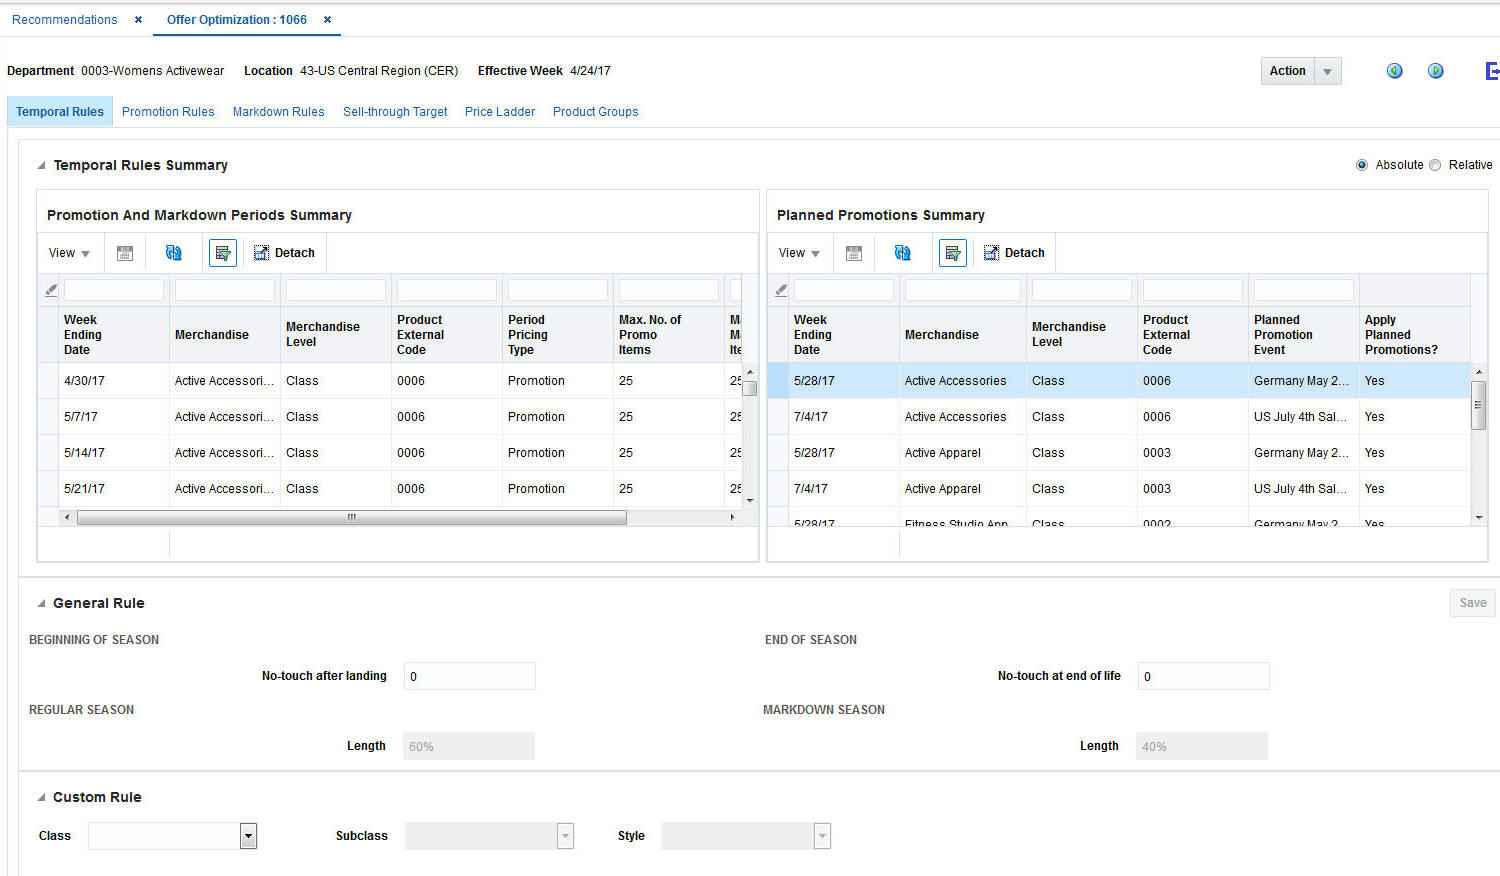
This screen, shown in Figure 10-14, is used to specify the business rules associated with temporal aspects of the pricing problem. There are two ways you can specify the temporal rules. The first approach is called "Absolute Calendar" and the second approach is called "Relative Calendar". The key difference between the two approaches is that the retailer uses actual dates to specify the rules in the former and in the later uses relative weeks from start (that is, from when the item started selling based on certain criteria).
By default, Absolute Calendar is used to display the rules screens. You can make a change to the relative calendar only on the Temporal Rules screen. You can switch and use Relative Calendar only once, and the functionality is further disabled for that run. A pop-up alerts you that "This selection is final and cannot be reversed for this run."
When you specify using the Absolute Calendar (default option selected):
Default values at the class level are populated based on the interface.
The interface allows you to specify the promo, markdown, or no-touch absolute calendar at the class level. That is, for each period, the kind of pricing change that is allowed is specified through this interface.
Note that you cannot edit these class-level defaults in the UI. You can only override the class-level defaults by specifying the rules at lower levels of merchandise.
You can only modify no-touch at the beginning and at the end of life for all classes in the UI.
When you specify using the Relative Calendar:
Default rules at the class level are specified based on the default length of the promotion (60 percent) and default length of the markdown (40 percent).
You can edit the class-level defaults (for all classes) by modifying in the General Rule panel.
This calendar option is useful when the retailer introduces merchandise frequently into the store and a fixed or absolute calendar cannot be applied to all items that are in different phase (for example, regular vs. markdown) of the life.
The Absolute Calendar is useful when most of the items are introduced and exit at almost the same time. The Relative Calendar is useful when the retailer introduces items at frequent intervals and having a fixed calendar for all items is restrictive and pushes items into promotion or markdown too quickly within the items' life.
Table 10-11 Temporal Rules
| Field | Description |
|---|---|
|
Week Ending Date |
The week ending date for the period. Not editable field. |
|
Weeks From Start |
This field is non-editable and runs from Week 1 to Maximum no. of weeks available for the selected merchandise level. Depending on the no-touch values, the Weeks from Start are adjusted to begin at 1+No touch after Landing and end at N-No touch at end of life. Available with only Relative Calendar option. |
|
Merchandise |
Description of the merchandise. |
|
Merchandise Level |
Merchandise level of the rule. It can be Class, Subclass, or Style/Color. |
|
Product External Code |
Merchandise level's external code that can be identified by the retailer. |
|
Period Pricing Type |
Indicates whether the period is marked as Promotion Allowed or Markdown Allowed or No-touch. |
|
Max No. of Promo Items |
This feature is editable and provides the ability to limit how many items can be promoted for that period. Default value is the number of items at that merchandise level and name. When a period is marked as Promotion Allowed, then the Max No. of Markdown Items is disabled and set to 0. When a period is marked as No-touch, then this field is disabled and set to 0. |
|
Max No. of Markdown Items |
This feature is editable and provides the ability to limit how many items can be marked down for that period. Default value is the number of items at that merchandise level and name. When a period is marked as Markdown Allowed, then the Max No. of Promotion Items is disabled and set to 0. When a period is marked as No-touch, then this field is disabled and set to 0. |
|
Planned Promotion Event |
Name of the planned promotion event. UI does not provide the ability to modify or edit the events. They are loaded as part of data interface loads. |
|
Apply Planned Promotion? |
Indicates whether to apply the planned promotion event to the items in that merchandise level. This field provides the ability for the user to turn off planned promotions if a particular merchandise level (and selected stores) is not considered for planned promotions. Default value is that planned promotions are always turned on. |
|
No Touch After Landing |
Default value is 0 weeks and is applied at the item level (and for all the locations). Indicates that price of an item cannot be changed from the initial full price until 0 weeks have been completed after the item start selling (also referred to as model start date). |
|
No Touch at End of Life |
Default value is 0 weeks and is applied at the item level (and for all the locations). Indicates that price of an item cannot be changed in the last 0 weeks before the exit date. |
|
Length of Regular Season |
Default value is 60 percent and is applied at the item level (and for all the locations). Indicates that if the total season length of an item is 25 weeks, 15 weeks are allocated for promotions (also called regular season). Regular season occurs towards the beginning of the season. This field is enabled only for relative calendar and not for absolute calendar. |
|
Length of Markdown Season |
Default value is 40 percent and is applied at the item level (and for all selected locations). Indicates that if the total season length of an item is 25 weeks, 10 weeks are allocated for markdowns (also called clearance season). Clearance season occurs towards the end of the season. This field is enabled only for relative calendar and not for absolute calendar. |
|
Min No. of Promotion Items |
This feature is editable and provides the ability to specify minimum number of items to be promoted for that period. Default value is 0. When a period is marked as Markdown Allowed, then the Min No. of Promotion Items is disabled and set to 0. When a period is marked as No-touch, then this field is disabled and set to 0. |
|
Min No. of Markdown Items |
This feature is editable and provides the ability to specify minimum number of items to be marked down for that period. Default value is 0. When a period is marked as Promotion Allowed, then the Min No. of Markdown Items is disabled and set to 0. When a period is marked as No-touch, then this field is disabled and set to 0. |
In this screen, as shown in Figure 10-16, you can specify the rules associated with promotions, specifically the reactive promotions (and not the planned promotions).
The default values that are populated for this run, such as General Rule, are based on global parameters available in RSE_CONFIG. The retailer can choose to modify the global values during implementation.
Contextual area shows the percentage of rules specified by the merchandise-level, that is, percentage specified at Class-level vs. Subclass vs. Style/Color level.
The fields available are described in Table 10-12.
Table 10-12 Promotion Rules
| Field | Description |
|---|---|
|
Merchandise |
Description of the merchandise. |
|
Merchandise Level |
Merchandise level of the rule. It can be Class, Subclass, or Style/Color. |
|
Product External Code |
The merchandise level's external code that can be identified by the retailer |
|
Max No. of Promotion Weeks |
Default is total number of weeks in the season. This allows the user to limit how many weeks are available for promotions for a particular merchandise. |
|
Min First Promotion Discount |
Default value is 0 percent based on a global parameter specified on RSE_CONFIG. The minimum discount that is allowed for the first promotion in the season. |
|
Max First Promotion Discount |
Default value is 0 percent based on a global parameter specified on RSE_CONFIG. The maximum discount that is allowed for the first promotion in the season. |
|
Min Other Promotion Discount |
Default value is 0 percent based on a global parameter specified on RSE_CONFIG. The minimum discount that is allowed for the subsequent promotions (except the first) in the season. |
|
Max Other Promotion Discount |
Default value is 100 percent based on a global parameter specified on RSE_CONFIG. The maximum discount that is allowed for the subsequent promotions (except the first) in the season. |
|
Min Time Between Promotions |
Default value is 1 week based on a global parameter specified on RSE_CONFIG. The minimum time (in periods or weeks) between consecutive promotions in the season. Suppose there are 4 months in the promotion season, and the min time is 4 weeks, then roughly 1 promotion week is available per month. |
|
Promotion Start Day |
Default value is Monday. This says when the promotion can start within a week. |
|
Promotion End Day |
Default value is Sunday. This says when the promotion can end within a week. |
|
Daily Weights |
Default values for each day of the week is populated based on the global values specified in RSE_CONFIG or values coming through an interface. These values represent the default values for all customer segments and for all time periods (e.g. weeks). This helps spread the weekly forecast into daily forecasts depending on when the promotion is applicable (e.g., Thu-Sun) for that week. |
In this screen, as shown in Figure 10-17, you can specify the rules associated with markdowns.
The default values that are populated for this run, such as General Rule, are based on global parameters available in RSE_CONFIG. The retailer can choose to modify the global values during implementation.
Contextual area shows the percentage of rules specified by the merchandise-level, that is, percentage specified at Class level vs. Subclass vs. Style/Color level.
The fields available are described in Table 10-13.
Table 10-13 Markdown Rules
| Field | Description |
|---|---|
|
Merchandise |
Description of the merchandise. |
|
Merchandise Level |
Merchandise level of the rule. It can be Class, Subclass or Style/Color. |
|
Product External Code |
The merchandise level's external code that can be identified by the retailer. |
|
Max No. of Markdown Weeks |
Default is total number of weeks in the season. This allows the user to limit how many weeks are available for markdowns at particular merchandise. |
|
Min First Markdown Discount |
Default value is 0 percent based on a global parameter specified on RSE_CONFIG. The minimum discount that is allowed for the first markdown in the season. |
|
Max First Markdown Discount |
Default value is 100 percent based on a global parameter specified on RSE_CONFIG. The maximum discount that is allowed for the first markdown in the season. |
|
Min Other Markdown Discount |
Default value is 0 percent based on a global parameter specified on RSE_CONFIG. The minimum discount that is allowed for the subsequent markdown (except the first) in the season. |
|
Max Other Markdown Discount |
Default value is 100 percent based on a global parameter specified on RSE_CONFIG. The maximum discount that is allowed for the subsequent markdowns (except the first) in the season. |
|
Min Time Between Markdowns |
Default value is 1 week based on a global parameter specified on RSE_CONFIG. The minimum time (in periods or weeks) between consecutive markdowns in the season. Suppose there are four months in the clearance season, and the min time is four weeks, then roughly one markdown week is available per month. |
|
Markdown Start Day |
Default value is Monday. This says when the markdown starts within a week. Markdowns are assumed to last the entire full week. |
|
Daily Weights |
Default values for each day of the week is populated based on the global values specified in RSE_CONFIG or values coming through an interface. These values represent the default values for all customer segments and for all time periods (e.g. weeks). This helps spread the weekly forecast into daily forecasts depending on when the markdown is applicable (e.g., Thu-Wed). |
|
Max Absolute Markdown Discount |
Default value is 100 percent, based on a global parameter specified on RSE_CONFIG. The maximum discount (of full price) that is allowed for any markdown in the season. |
Min Other Markdown and Max Other Markdown Discount need further explanation. Consider the following example. Suppose the user sets these values to 25 percent and 50 percent, respectively, for an item with full price of $100. If the first markdown was 20 percent, then the item's ticket price drops to $80. Because of the Min Other and Max Other Markdown Discount, the second markdown will be limited to a value between $80 *(1-0.25) = $60 (or 40 percent off) and $80 * (1-0.50) = $40 (or 60 percent off). Of course, if there was a Max Absolute Markdown Discount of 50 percent, then the second markdown would be further constrained to be between $60 and $50.
In this screen, as shown in Figure 10-18, you can specify the sell-through targets by week and by merchandise. The default values that are populated for this run, such as General Rule, are based on global parameters available in RSE_CONFIG. The retailer can choose to modify the global values during implementation.
Contextual area shows the percentage of rules specified by the merchandise-level, that is, percentage specified at Class level vs. Subclass vs. Style/Color level.
Depending on the calendar option selected in the Temporal Rules Screen, this screen will use either the Absolute Calendar or the Relative Calendar option. The Absolute Calendar is useful when most of the items are introduced and exit at almost the same time. The Relative Calendar is useful when the retailer introduces items at frequent intervals and having a fixed calendar for all items is restrictive and pushes items into promotion or markdown too quickly during the items' life.
The fields available are described in Table 10-14.
Table 10-14 Sell-Through Target
| Field | Description |
|---|---|
|
Week Ending Date |
The week ending date for the period. Not editable field. |
|
Weeks From Start |
This field is non-editable and it runs from Week 1 to Maximum no. of weeks available for the selected merchandise level. Depending on the no-touch values, the Weeks from Start are adjusted to begin at 1+No touch after Landing and end at N-No touch at end of life. Available with only Relative Calendar option. Available with only Relative Calendar option. |
|
Merchandise |
Description of the merchandise. |
|
Merchandise Level |
Merchandise level of the rule. It can be Class, Subclass or Style/Color. |
|
Product External Code |
The merchandise level's external code that can be identified by the retailer. |
|
Target Sell-through |
Sell-through target at the end of the specified period for the merchandise as percentage (0% - 100%). If enforced as Hard, then this sell-through target must be met otherwise the optimization will not return any solution. |
|
Sell-through Target at end of Regular Season |
Default value is 0 percent based on global parameter specified on RSE_CONFIG. The sell-through target that needs to be achieved by the end of the regular season. |
|
Sell-through Target at end of Clearance Season |
Default value is 0 percent based on global parameter specified on RSE_CONFIG. The sell-through target that needs to be achieved by the end of the clearance season. This value has to be higher than the target at the end of the regular season otherwise it is ignored. |
|
All Sell-through Targets are enforced as Hard? |
Default value is soft (or unchecked) based on global parameter specified on RSE_CONFIG. If enforced as Hard, then all the sell-through targets must be met otherwise the optimization will not return any solution. |
|
Salvage Value % |
Non-editable field. Default value is 0 percent based on global parameter specified on RSE_CONFIG. The Salvage value for an item is calculated using this percentage as, Salvage value percentage multiplied by the full price of the item. |
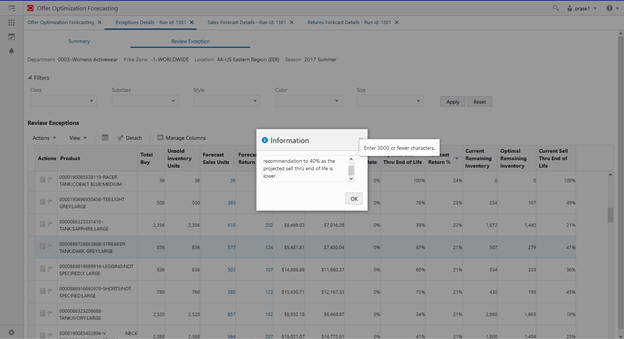
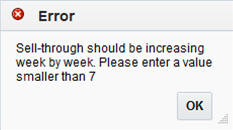
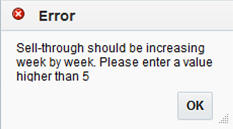
When you enter custom sell-through target values by week, the system validates that the percentage must be non-decreasing for the selected merchandise level. It returns an error indicating the same. In Figure 10-19, the user entered a value higher than 7 for Week Ending Date 5/28/17.
Figure 10-19 Error: Value Greater Than Seven
Similarly, if the user entered a value lower than 5 then that also throws a validation error.
Figure 10-20 Error: Value Less Than Five
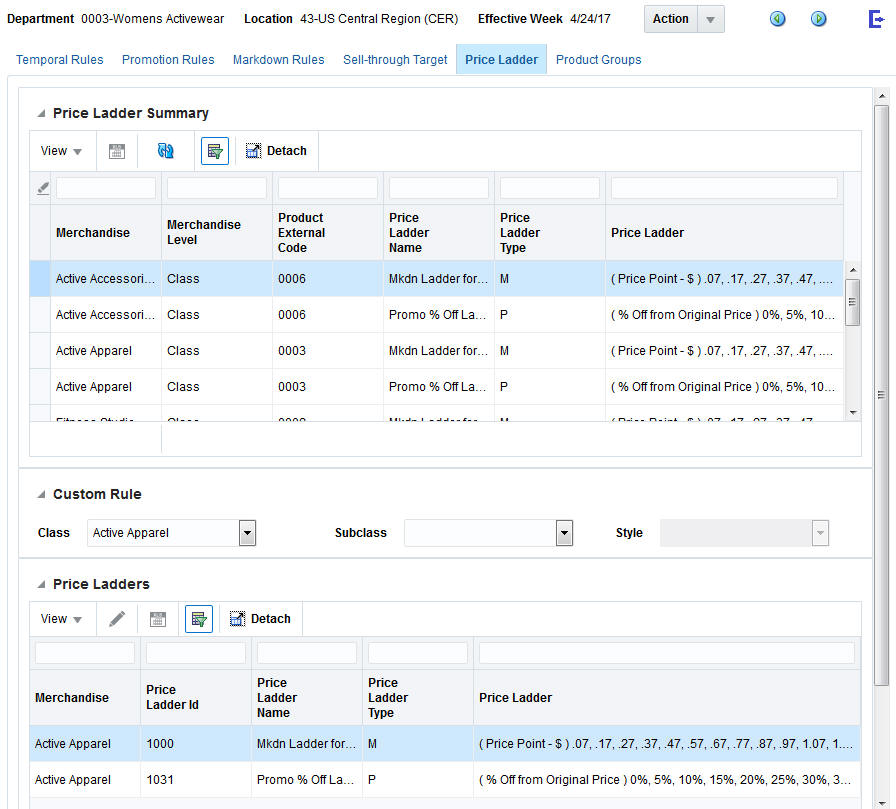
In this screen, as shown in Figure 10-21, you can assign price ladders that have been loaded and are available for the selection location and merchandise levels. You can load as many price ladders at different merchandise levels (Class and above). By default, the system assigns one price ladder for promotion and one for markdown at the Class level that is closest to the class under consideration.
The contextual area shows the percentage of rules specified by the merchandise level, that is, the percentage specified at Class level vs. Subclass vs. Style/Color level.
The fields available are described in Table 10-15.
Table 10-15 Price Ladders
| Field | Description |
|---|---|
|
Merchandise |
Description of the merchandise. |
|
Merchandise Level |
Merchandise level of the rule. It can be Class, Subclass or Style/Color. |
|
Product External Code |
The merchandise level's external code that can be identified by the retailer. |
|
Price Ladder Name |
Name for the price ladder. |
|
Price Ladder Type |
Type indicates whether price ladder is for Promotions (P) or Markdowns (M). |
|
Price Ladder Values |
Values available for this price ladder. Price Ladder can be a percentage ladder (off full price or current ticket price) or a price-point ladder. Currency for the run shown depends on the locale loaded during the implementation. |
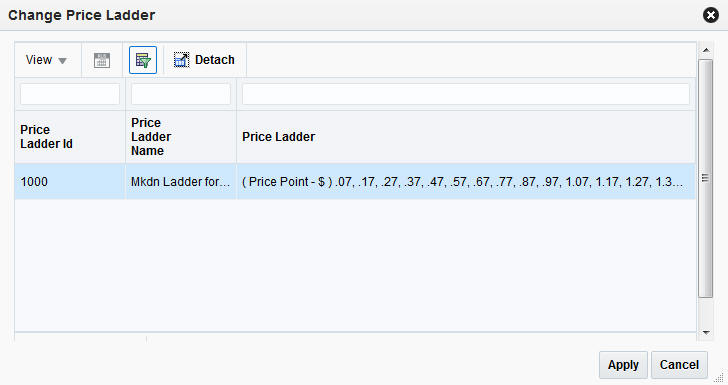
As shown in Figure 10-22, in the Custom Rule, you can pick one price ladder for Promotion and one for Markdown, based on the set of available ladders at that merchandise level. You can select one row and click Edit to override the price ladder for that merchandise and price ladder type. You can select any price ladder in the Change Price Ladder pop-up and click Apply.
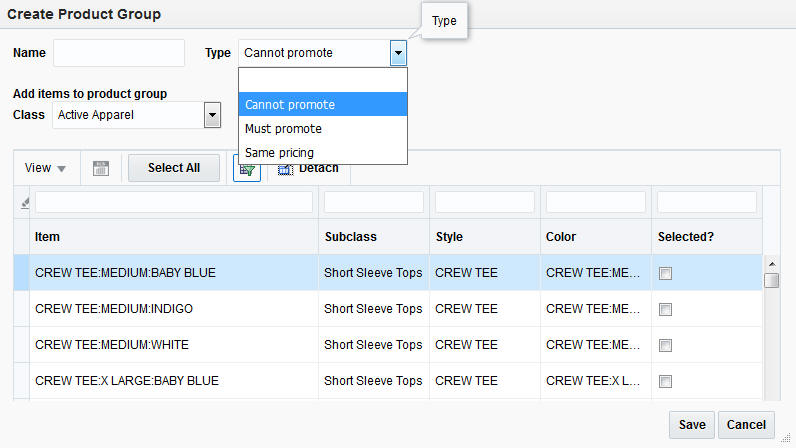
In this screen, shown in Figure 10-23, you can group products within a class such as Cannot Promote, Must Promote, or Same Pricing.
In the Cannot Promote group, at most one product of the group can be promoted in a given week (or time period). For example, competing brands such as Levis vs. Calvin Klein cannot be promoted at the same time.
In the Must Promote group all the items must be promoted if any one item of the group is promoted in a given week (or time period).
In the Same Pricing group, all the items receive same percentage off recommendations over the life of the item. Notice that the final absolute recommended price can be different for items within this group.
You can click Create New to display a Create Product Group interface. You must enter a group name and the group type from the drop-down list. You can select a product, one at a time, and add it to the group. Alternatively, you can filter the products using Query by Example, use Select All to add the products to the group, and then click Save. There is no conflict checking or validation in place, so you must be careful when putting products in two conflicting groups (for example, must promote and cannot promote).
The contextual area shows the percentage of groups specified by the group type, that is, the percentage of groups categorized as Cannot Promote vs. Must Promote vs. Same Pricing.
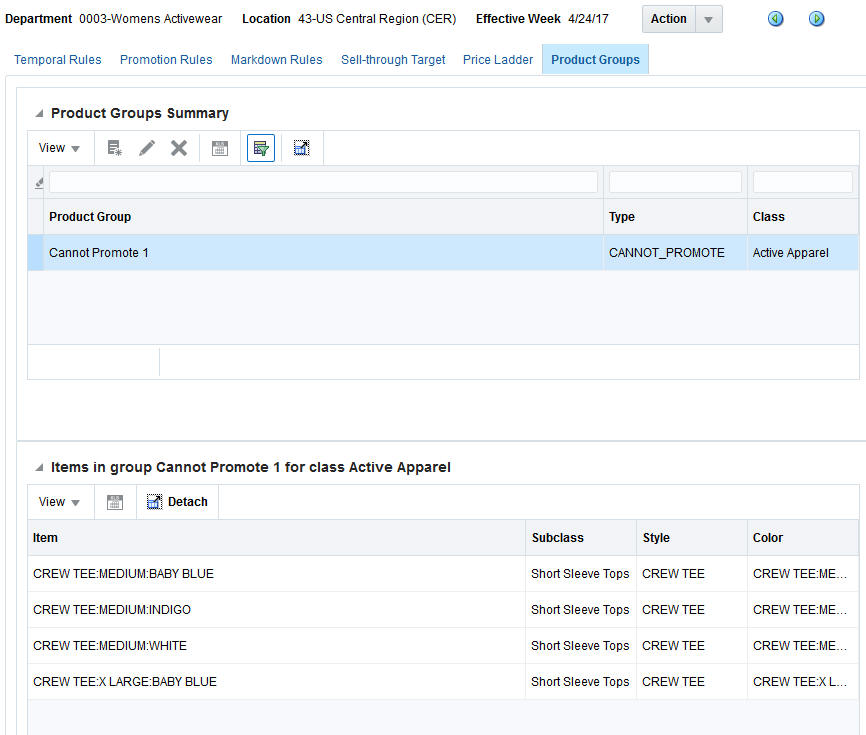
All the groups created are shown in the Product Groups Summary. You can select any group, and the set of products within that group are displayed. You can edit or delete any group shown in the Summary panel.
After the optimization run is complete, the results are displayed in the Results stage. In this stage, you can accept, reject, or override any price recommendation. After you make substantive changes, you can change the appropriate settings or recalculate all the projected metrics.
The results are displayed in five tiles: Revenue Tile, Promotion Tile, Markdown Tile, Targeted Tile, and Offers Tile.
From the Results stage, you can:
Recalculate the projected metrics after making price overrides.
Revisit earlier stages in order to make changes to various settings and then re-optimize the run.
Review the run and change the status to Reviewed.
Submit the run that writes the recommendations to Export Interface and also sends the results to a downstream price execution system such as CE or RPM.
Leave the run in the optimization list without taking any actions. You cannot delete the run; you must be in Overview in order to delete a run.
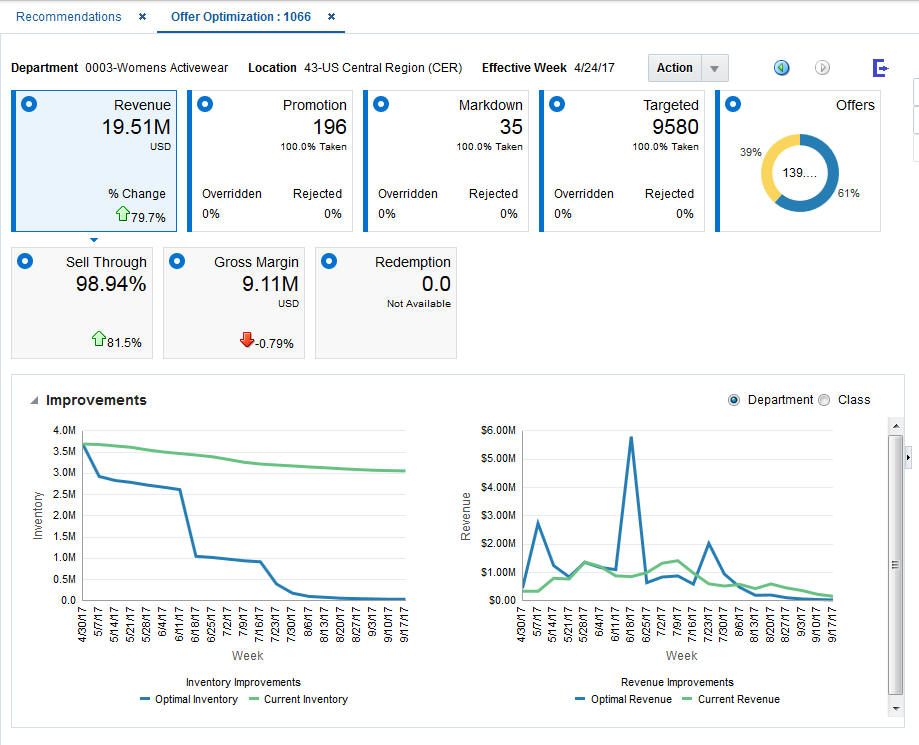
As shown in Figure 10-25, the revenue tile displays the overall summary of the run in forms of tiles as well as in BI charts. Information displayed in this tile is non-editable.
Revenue. This is the projected revenue over the life of the items, assuming that you accept all recommendations. This is displayed in the local currency defined for the location of the run.
Revenue % Change. This is the percentage gain or loss in revenue compared to staying at the current price for all items over their entire life.
Sell Through. This is the projected sell through at the end of the life, assuming that you accept all recommendations. This is shown as a percentage of initial inventory (or inventory at the beginning of the season).
Sell Through % Change. This is the percentage gain or loss in end of life sell-through, compared to staying at the current price for all items over their entire life.
Gross Margin. This is the projected gross margin over the life of the items, assuming that you accept all recommendations. This is shown in the local currency defined for the location of the run.
Gross Margin % Change. This is the percentage gain or loss in gross margin, compared to staying at the current price for all items over their entire life.
The bottom panel displays the improvements as two BI charts: Inventory vs. Time and Revenue vs. Time. By default, the information in the chart is at the Department level. However, you can do a deep dive into a particular class by toggling the radio button to Class and selecting a class from the drop-down list of classes.
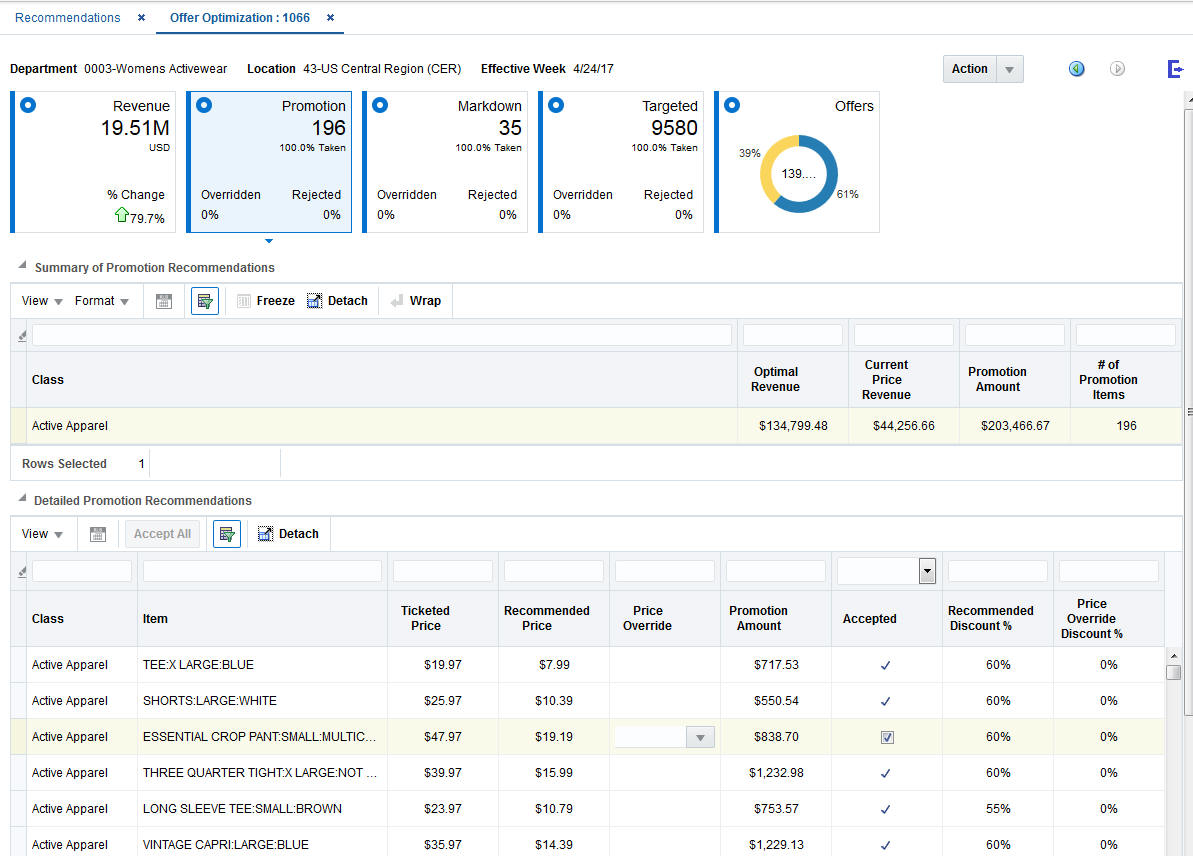
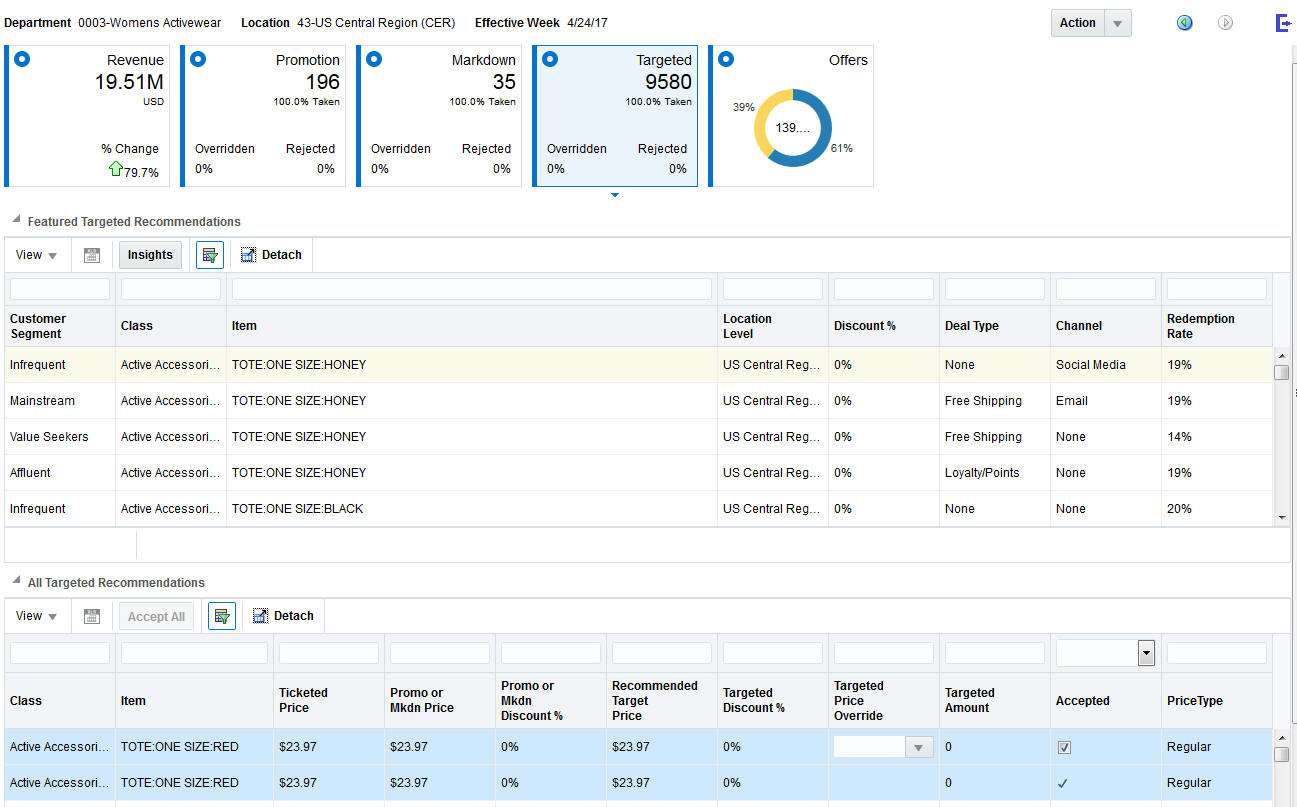
This tile displays the promotion recommendations for the effective week selected. In the tile, it shows the total number of promotion recommendations (items), percentage of recommendations taken or accepted, percentage of recommendations overridden, and percentage of recommendations rejected.
In the summary panel, the Class-level overview of the promotion recommendations is displayed. It contains the following metrics (non-editable):
Optimal Price Revenue. Projected optimal price revenue for this week over all items with promotion recommendation at the class level.
Current Price Revenue. Projected revenue at current price for this week over all items with promotion recommendation at the class level.
Promotion Amount. This is calculated as the amount spent due to the discount offered multiplied by the projected sales units at the class level. This is the amount given towards promotions at the class level.
# of Promotion Items. This is the total number of items at class level that have received a promotion recommendation.
You can select a class in the top summary panel; then the detailed panel is populated. The Detailed Panel displays all the item recommendations for the selected effective week.
In the detailed panel, you can accept, reject, or override the price recommendation for the effective week. It contains the following information:
Class. Name of the class.
Item. Description of the item.
Ticket Price. Current ticket price of the item.
Recommended Price. Price recommended by the optimization.
Price Override. You can click the box and it displays a price ladder assigned for that item. You can choose a price from the price ladder. The price override is applied only to the effective week. Any price overrides are not reflected in the projected metrics until the user selects re-calculate button.
Promotion Amount. This is calculated as the amount spent due to the discount offered multiplied by the projected sales units at the item level. This is the amount given towards promotions.
Accepted. You can uncheck or check the box to indicate whether to accept or reject the recommendation. When the recommendation is rejected, it reverts to the current ticket price.
Recommended Discount %. This field is non-editable. This shows the percentage discount offered with respect to the full price for the item selected, based on the recommended price.
Price Override Discount %. This field is non-editable. This shows the percentage discount offered with respect to the full price for the item selected, based on the Price Override column.
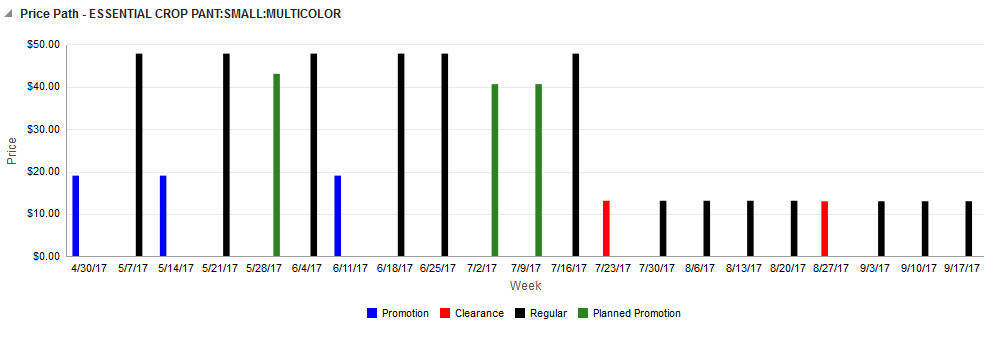
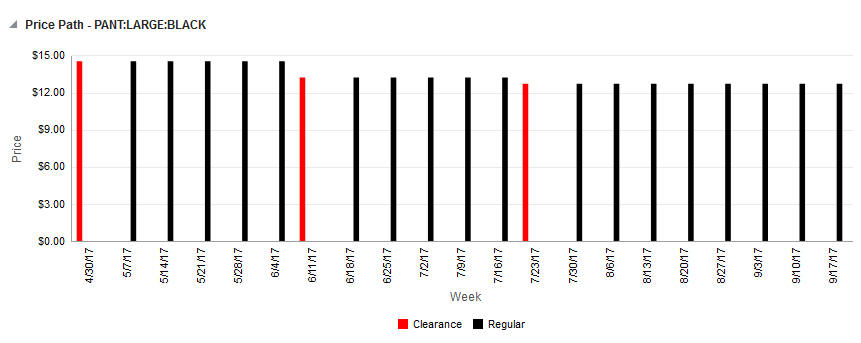
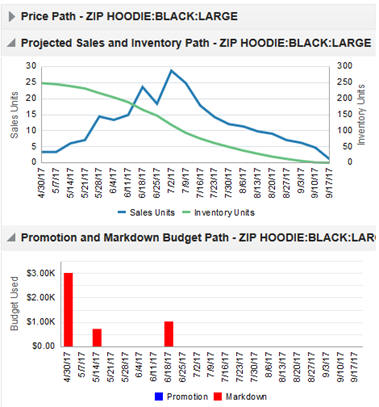
You can see the full price path for an item in the contextual area, as shown in tFigure 10-27. Each price type is shown in different color: Black - Regular Price, Grey - Override, Blue - Promotion, Red - Markdown, Green - Planned Promotion. You can also see the Projected Sales and Inventory Path and Projected Budget Usage for Promotions and Markdowns (Figure 10-28).
Figure 10-28 Projected Sales and Inventory Path and Budget Usage Path
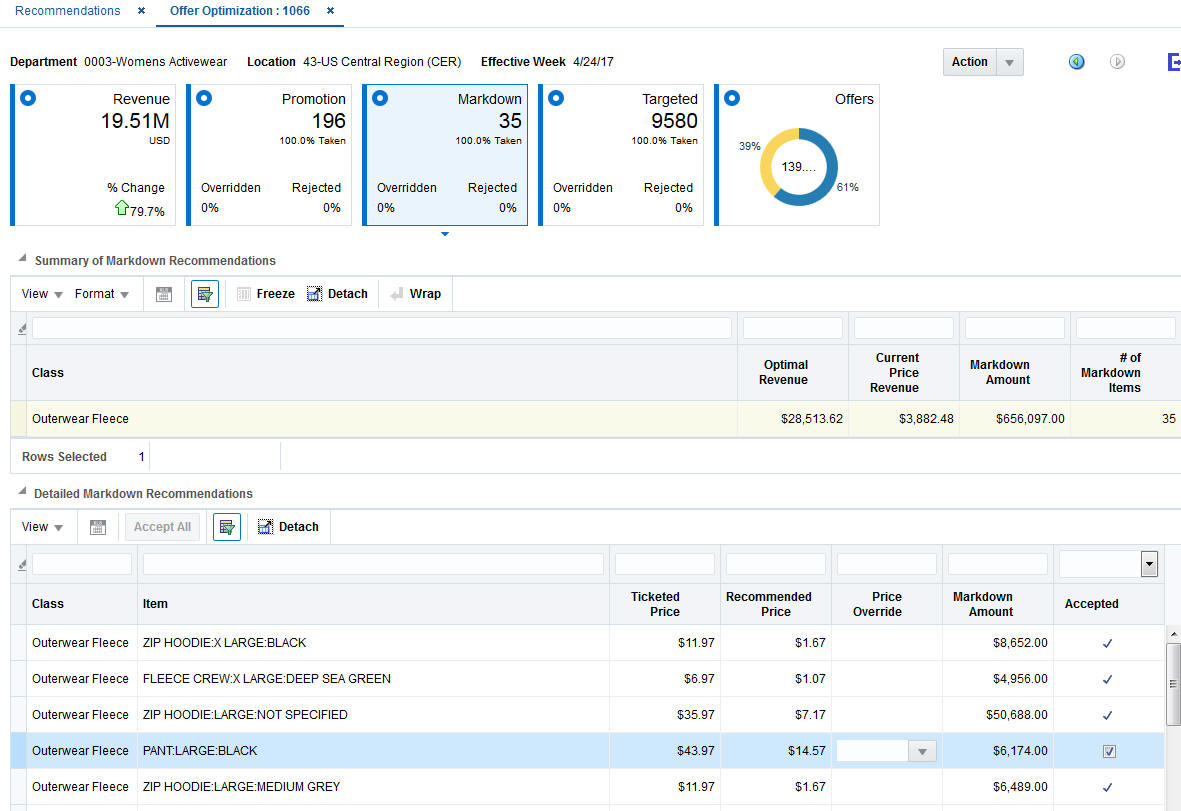
The Markdown Tile displays the markdown recommendations for the effective week selected. In the tile, it shows the total number of markdown recommendations (items), percentage of recommendations taken or accepted, percentage of recommendations overridden, and percentage of recommendations rejected.
In the summary panel, it displays the class level overview of the markdown recommendations. It shows the following metrics (non-editable):
Optimal Price Revenue. Projected optimal price revenue for this week over all items with promotion recommendation at the class level.
Current Price Revenue. Projected revenue at current price for this week over all items with promotion recommendation at the class level.
Markdown Amount. This is calculated as the amount spent due to the discount offered multiplied by the projected sales units at the class level. This is the amount given towards promotions at the class level.
# of Markdown Items. This is the total number of items at the class level that have received a markdown recommendation.
You can select a class in the top summary panel, and the detailed panel is populated. The Detailed Panel displays all the item markdown recommendations for the selected effective week.
In the detailed panel, the user can accept, reject or override the price recommendation for the effective week. It contains the following information:
Class. Name of the class.
Item. Description of the item.
Ticket Price. Current ticket price of the item.
Recommended Price. Price recommended by the optimization.
Price Override. You can click the box and it displays a price ladder assigned to that item. You can select a price from the price ladder. The price override is applied to the effective week and propagated appropriately to future weeks. Any price overrides are not reflected in the projected metrics until the user selects the re-calculate button.
Markdown Amount. This is calculated as the amount spent due to the discount offered multiplied by the projected sales units at the item-level. This is the amount given towards promotions.
Accepted. You can uncheck or check the box to denote whether to accept or reject the recommendation. When the recommendation is rejected, it reverts to the current ticket price.
You can see the full price path for an item in the contextual area, as shown in Figure 10-30. Each price type is shown in a different color: Black - Regular Price, Grey - Override, Red - Markdown, Green - Planned Promotion. You can also see the Projected Sales and Inventory Path and Projected Budget Usage for Promotions and Markdowns (Figure 10-28).
The Targeted Tile displays the targeted recommendations for the effective week selected. In the tile, it shows the total number of targeted recommendations (items), percentage of recommendations taken or accepted, percentage of recommendations overridden, and percentage of recommendations rejected.
In the Featured Targeted Offers panel, it displays Item, Deal type, and Channel offers by class and segment that result in the best redemption rate. It displays the following metrics (non-editable):
Customer Segment. Name of the customer segment.
Class. Name of the class.
Location. Name of the selected location.
Discount %. Recommended discount percentage for the item.
Deal Type. Deal type (for example, Z% Off, Loyalty Points) associated with this item that result in a high redemption rate for this segment.
Channel. Channel (for example, Email, Mobile) associated with this item that result in a high redemption rate for this segment.
Redemption Rate. Predicted redemption rate for this offer.
You can select a class segment in the top featured targeted offers panel. The detailed panel is then populated with all the item level price recommendations for this effective week. You can override the targeted price recommendations in this panel.
In the detailed panel, you can accept, reject, or override the targeted price recommendation for the effective week. It contains the following information:
Class. Name of the class.
Item. Description of the item.
Ticket Price. Current ticket price of the item.
Promo or Markdown Price.
Promo or Markdown Discount %.
Recommended Target Price. Price recommended by the optimization.
Targeted Discount %.
Targeted Price Override. You can click the box, and it displays a price ladder assigned for that item. You can select a price from the price ladder.
Targeted Amount. This is calculated as the amount spent due to the discount offered multiplied by the projected sales units at the item-level. This is the amount given towards targeted offers.
Price Type. Denotes whether the price recommendation is regular, markdown, promotion, or targeted.
Accepted. You can uncheck or check the box to denote whether to accept or reject the targeted recommendation. When recommendation is rejected, it reverts to location-level price recommendation or override.
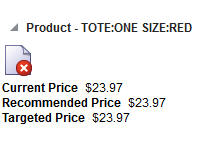
You can see the product image (if loaded) and the current price, recommended price, and targeted price for the item in the contextual BI area.
Figure 10-32 Targeted Price Recommendation
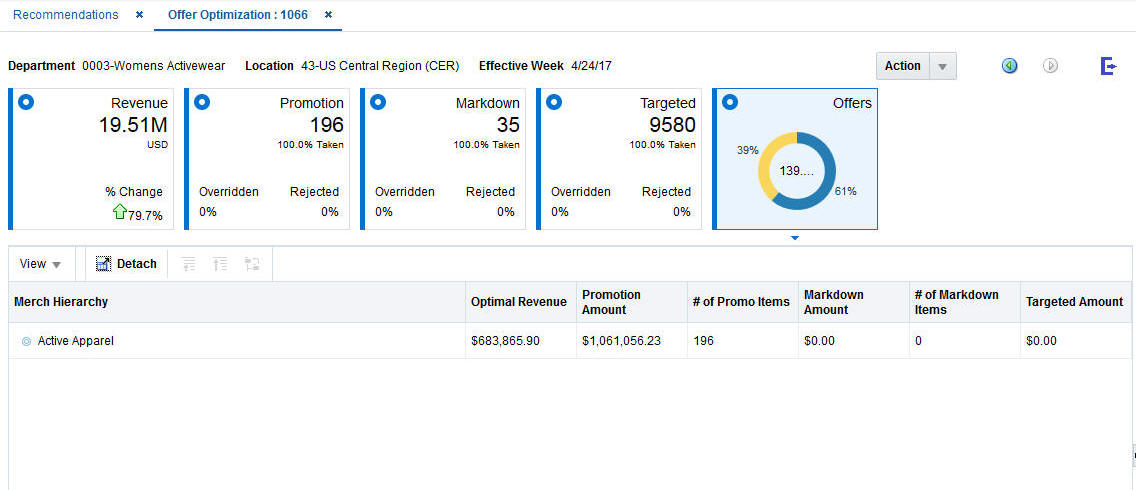
The Offers Tile displays all the recommendations for the effective week selected. In the tile, it displays the percentage of the amount used for promotions, the percentage of amount used for markdowns, and the percentage of amount used for targeted offers.
In the tree table below, it shows the number of promotion recommendations, the number of markdown recommendations, and the corresponding amounts by merchandise hierarchy.
The accepted recommendations for runs that are in Submitted status are sent for export. Once the run has entered a Submitted status, you cannot modify any aspects of the run. If you decide to send another run for the same Department, Location, Season, and Effective Week, then the new recommendations will override the old recommendations. See the interface guide for details on the export interface.
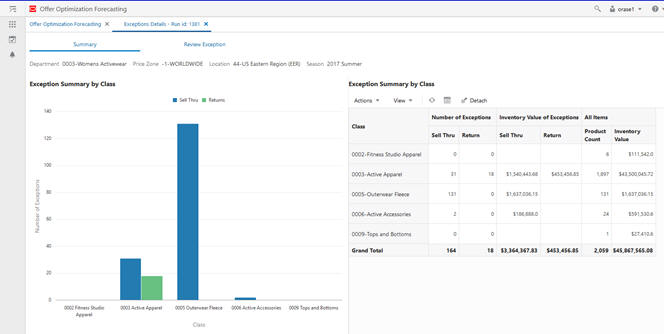
See the Innovation Workbench chapters for details. Apart from the core hierarchy tables, the following validation and result tables that are applicable for offer optimization are exposed in read-only mode. You can slice and dice the results table for reporting purposes and examine the validation table to determine why a particular run has ended in Failed status. The tables are:
PRO_RUN_SANITY_CHECK_RSE_VW contains information on the errors/alerts/warnings generated.
PRO_RUN_RECOM_OPT_RESULT contains all the results associated with Offer Optimization Forecasting promotions, markdowns, and targeted pricing recommendations.
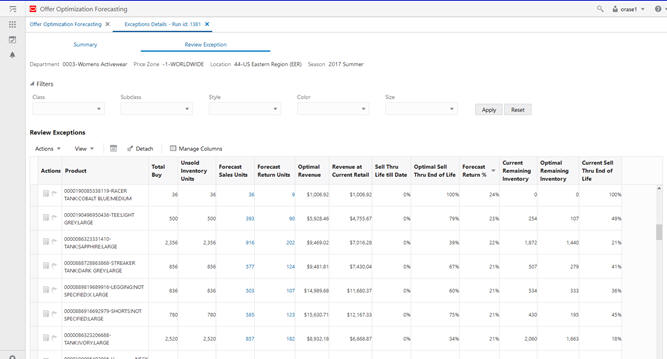
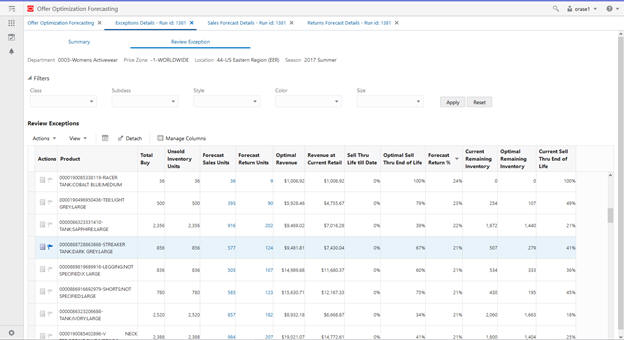
Offer optimization forecasting is used to review the sales forecasts, returns forecasts, and exceptions of a successfully executed offer optimization run.
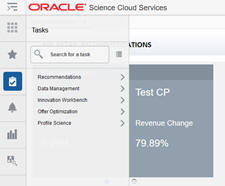
To access the forecast information, click the Task icon on the login screen and then select Offer Optimization from the list of tasks shown in Figure 10-34. You see three options, Offer Optimization Overview, Manage OO Recommendations, and Offer Optimization Forecasting, as shown in Figure 10-35.
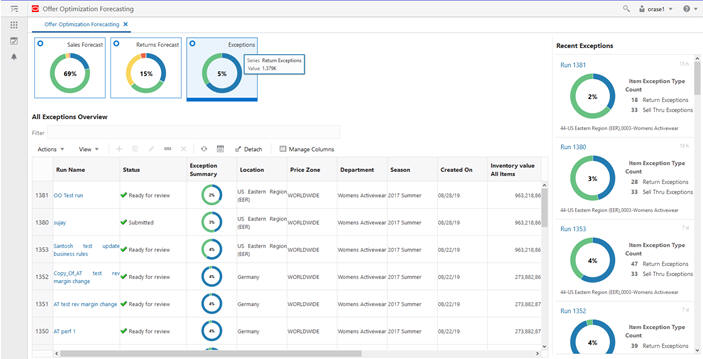
Select Offer Optimization Forecasting. You see the Offer Optimization Forecasting tab shown Figure 10-36. This tab has three tiles, Sales Forecast, Returns Forecast, and Exceptions. When you open a new Offer Optimization Forecasting window, shown in Figure 10-36, the Sales Forecast tile is highlighted and the sales forecast summary metrics are shown for all the successfully executed Offer optimization runs. The Notification Bar is displayed on the right.
Figure 10-36 Offer Optimization Forecasting
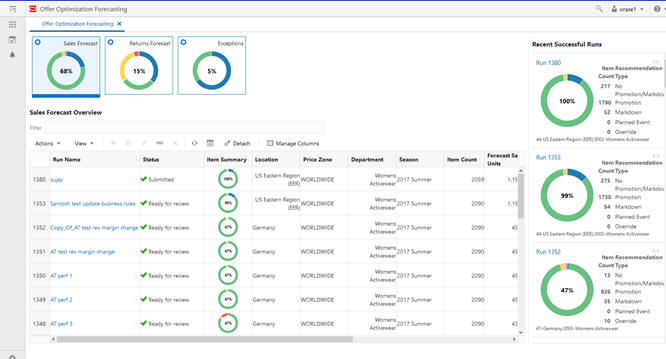
The Sales Forecast tile displays the following information across all OO runs for the next effective date.
The pie chart displays the various price changes recommended by the Offer Optimization system for the effective date.
The center content of the pie chart displays the percentage of items/products receiving a forecast.
The notification bar on the right displays the same information as the Sales Forecast tile for the most recent successful runs. For each run in the notification bar, the top left corner displays the run ID and the bottom left corner displays the Location and Department for the run.
The sales forecast overview table displays the run information corresponding to the run ID from Offer Optimization, along with additional metrics such as item count, forecast sales units, returns units, total buy, and projected end of life sell thru.
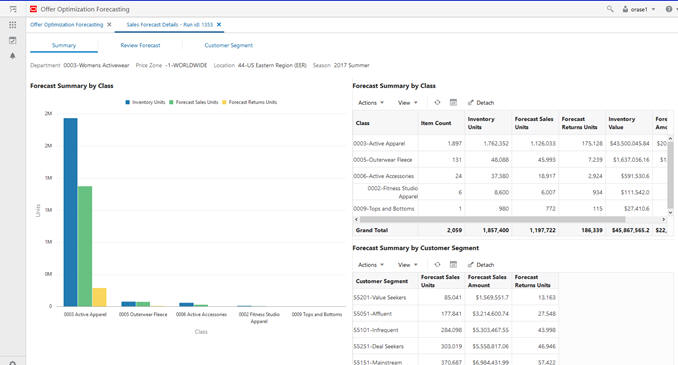
From the sales forecast run overview table, you can select an individual run by clicking the run name. This opens up a new tab, Details for Run <with ID#>, with three sub-tabs: "Summary Tab", "Review Forecast Tab" and "Customer Segment Tab".
The Summary tab, shown in Figure 10-37, displays additional details at the class level and customer segment level for the selected run ID. It provides aggregate metrics by class and customer segment.
The Summary tab has the following three components:
Chart for forecast summary by class. This displays the following metrics by class across the entire forecast horizon: remaining inventory, forecast sales units, and forecast return units. The forecast horizon represents all weeks in the future until the exit date for a product.
Remaining inventory is the total number of unsold inventory units the optimization system is trying to clear, based on the latest sales and inventory information for the run.
Forecast sales units is the sum of the forecast sales units over the entire forecast horizon.
Forecast return units is the sum of all future expected returns over the entire forecast horizon.
Table for forecast summary by class. In addition to the metrics displayed in the chart, the following metrics are displayed in the table: item count, unsold inventory value, and forecast sales amount.
Item count is the number of products in the class.
Unsold inventory value is the total value of unsold inventory units that the optimization system is trying to clear, based on the latest sales and inventory information for the run.
Forecast sales amount is the sum of the forecast sales amount over the entire forecast horizon.
Table for forecast summary by customer segment. This displays the forecast sales units, forecast sales amount, and forecast returns unit by customer segment.
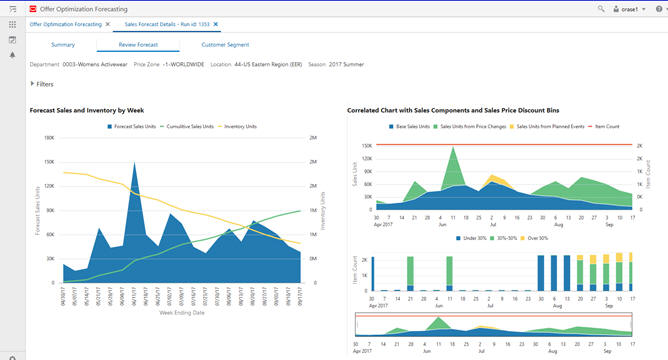
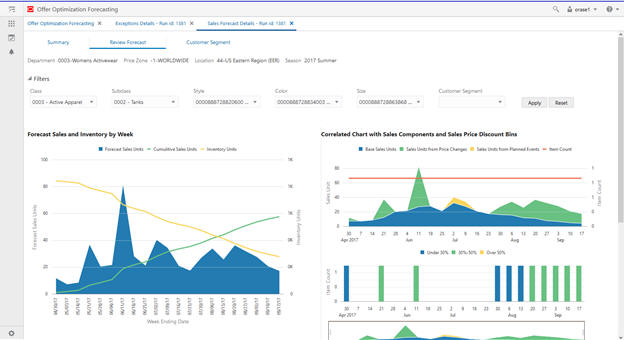
The Review Forecast tab, shown in Figure 10-38, is used to view the forecast information at the week level. It displays a breakdown of the sales forecast into multiple components such as base sales units, sales units from price cuts and sales units from promotion events, and the count of products at various discount levels. This tab displays information for the selected merchandise and customer segment.
You can review the forecast information for the selected merchandise and customer segment combination. By default, this chart shows the information at the department level for the merchandise hierarchy and across all customer segments. Use the Filters to display and select a specific merchandise and customer segment.
All the merchandise levels below the offer optimization run level can be selected. In this example, you see Class, Subclass, Style, Color, and Size. The selection of merchandise using the filters follows a hierarchical path. First, select a specific class. Then, click Apply to review the information for this class or choose a specific subclass within the class and click Apply. After selecting a specific subclass, you can choose the styles within the subclass, and so on.
The Review Forecast tab has the following three components:
Chart for forecast sales and inventory by week, as shown in Figure 10-38.
Aggregate sales, inventory units, and cumulative sales by week for the merchandise and customer segment selection made in the filters.
Correlated chart with sales components and discount bins, as shown in Figure 10-38.
It breaks down the forecasted sales in the following components:
Forecasted base sales units: future sales at the current ticket price
Forecast lifted sales units: additional sales units driven by recommended price changes (that is, promotions and markdowns)
Forecast promo sales units: additional sales units driven by promotion event/holiday event.
It shows the breakdown of items into various discount bins for each week. Discount bins are calculated using the forecast sales price and full price.
The bottom window of the chart is used to select the time frame used for displaying the top two charts. Use this to focus on the relevant weeks when the forecast horizon is long.
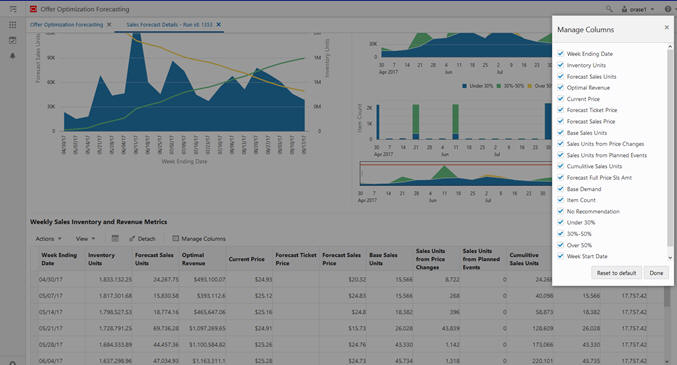
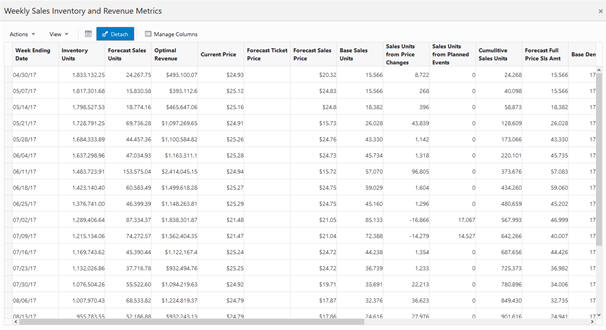
Table with weekly sales inventory and revenue metrics, as shown in Figure 10-39, can be used to:
Examine the weekly metrics displayed in the charts, as shown in Figure 10-37 and Figure 10-38.
Use Manage columns, shown in Figure 10-39, to select the metrics displayed in the table.
Use the Detach button to expand the table into a pop-up window for ease of use, as shown in Figure 10-40.
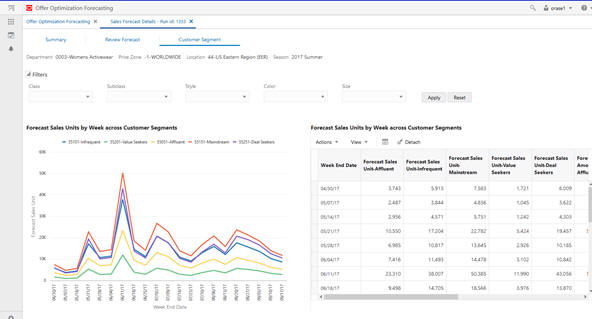
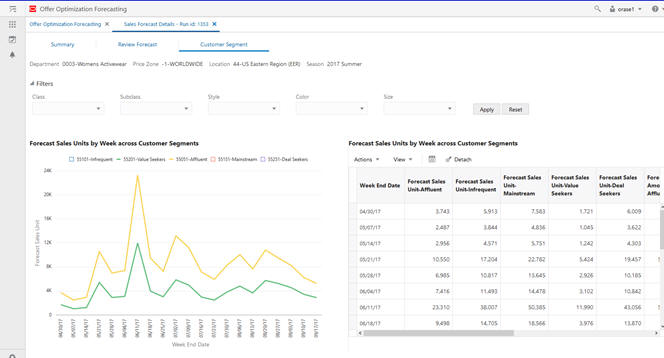
The Customer Segment tab, shown in Figure 10-41, is used to compare the sales trends across the various segments.
Use this tab to compare the sales trends across various customer segments. Similar to Forecast review tab, you can view the customer segment comparison for selected merchandise. The filtering functionality for merchandise works in the same way as in the Forecast review. In the chart, individual customer segments can be selected and un-selected by clicking on the legend. The chart is rescaled automatically based on the new selection, as shown in Figure 10-42. Rescaling is useful for reviewing patterns for customer segments with low sales volume.
Figure 10-42 Rescaling Based on New Selection
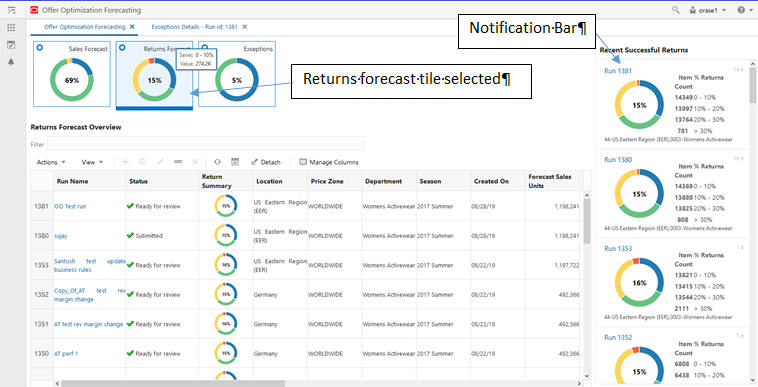
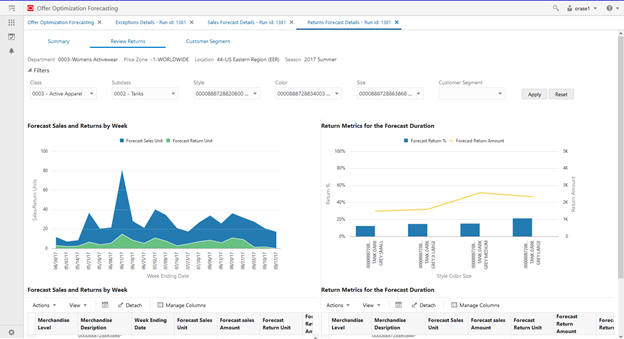
The Returns Forecast tile, shown in Figure 10-43, displays the following information across all OO runs for the next effective date.
The pie chart represents the count of products in the different returns percentage bins for the effective date. For example, in Figure 10-43, 274,200 products have a forecast returns percentage between 10% and 20%.
The center content of the pie chart displays the forecast returns as percentage of forecast sales from all products across all Offer Optimization runs for the most recent effective date.
The notification bar on the right displays the same information as the Returns Forecast tile for the most recent successful runs. For each run in the notification bar, the top left corner displays the run ID and the bottom left corner displays the Location and Department for the run.
The returns forecast overview table displays the run information corresponding to the run ID from Offer Optimization, along with additional metrics such as forecast returns units, forecast return percentage, return units life till date, and return % life till date.
From the returns forecast overview table, you can select an individual run by clicking on the run name. This opens up a new tab, Returns Forecast Details <with ID #>, with the three sub-tabs: "Summary Tab", "Review Returns Tab" and "Customer Segment Tab".
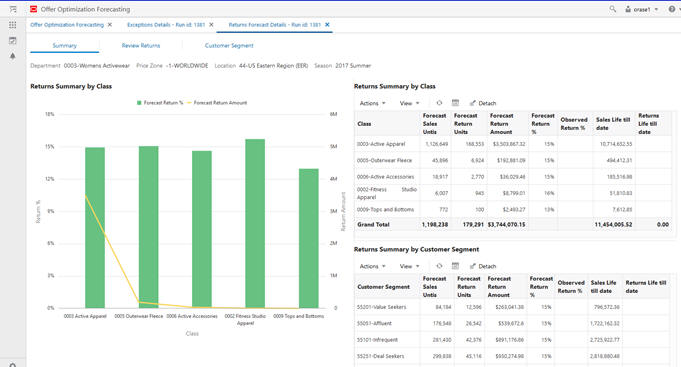
The Summary tab, shown in Figure 10-44, displays additional details at the class level and customer segment level for the selected run ID. It provides aggregate metrics by class and customer segment.
The Summary tab has the following three components
Chart for returns summary by class. This displays the following metrics by class across the entire forecast horizon: forecast return % and forecast return amount. The forecast horizon represents all weeks in the future until the exit date for a product.
Forecast return % represents the ratio of sum of forecast returns units over the entire forecast horizon across all products to sum of forecast sales units over the entire forecast horizon across all products in the class.
Forecast return amount represents the total value of the returned merchandise over the entire forecast horizon across all products in the class.
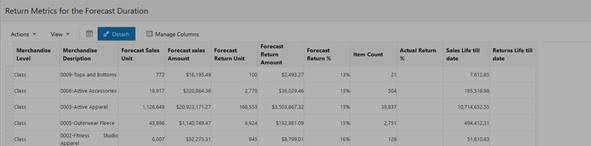
Table for returns summary by class. In addition to the metrics displayed in the chart, the following metrics are displayed in the table for every class: forecast sales units, forecast return units, sales units life till date, returns life till date, and observed return %.
Forecast sales units is the sum of forecast sales units over the entire forecast horizon across all products.
Forecast return units is the sum of forecast return units over the entire forecast horizon across all products.
Sales units life till date is the sum of actual sales units from the first sale date until the most recent week with sales data across all products.
Returns life till date is sum of actual return units from the first sale date until the most recent week with sales data across all products.
Observed return % is the ratio of returns life till date to Sales units life till date.
Table for returns summary by customer segment. This displays the following metrics by customer segment: forecast sales units, forecast return units, forecast return amount, forecast return %, sales units life till date, returns life till date, and observed return %.
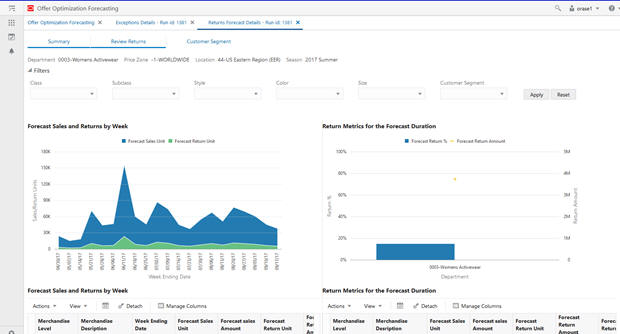
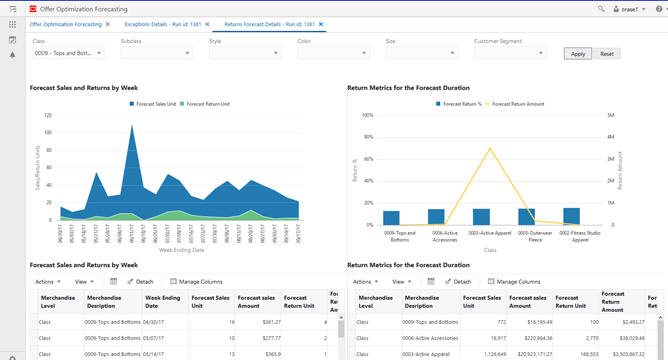
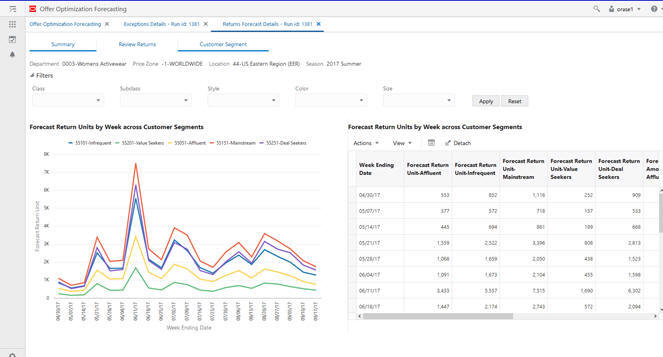
The Review Returns tab, shown in Figure 10-45, is used to view the returns information for the selected merchandise and customer segment.
You can review the returns information for the selected merchandise and customer segment combination. By default, this chart shows the information at the department level for the merchandise hierarchy and across all customer segments. Use the Filters to display the available options to select a specific merchandise and customer segment. Filtering works in the way that it does in the Review forecast tab, where the merchandise selection is made in the order of the merchandise hierarchy.
The Review Forecast tab has the following four components:
Chart for forecast sales and returns by week, as shown in Figure 10-45 and Figure 10-46.
It displays aggregate forecast sales units and forecast returns units by week for the merchandise and customer segment selection.
Chart to compare the return percentage and return amount across merchandise, as shown in Figure 10-45 and Figure 10-46.
Displays the forecast return % and forecast return amount for the selected merchandise along with other merchandise under the same parent. For example, when class 0009 tops and bottoms are selected, this chart displays the above metrics for all classes within the department corresponding to 0009 tops and bottoms.
The forecast return % is the ratio of the sum of forecast returns units over the entire forecast horizon across all products to the sum of forecast sales units over the entire forecast horizon across all products from the selected merchandise and customer segment.
The forecast return amount is the total value of the returned merchandise over the entire forecast horizon across all products in the selected merchandise and customer segment.
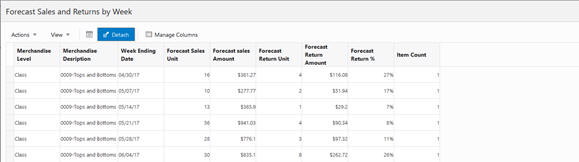
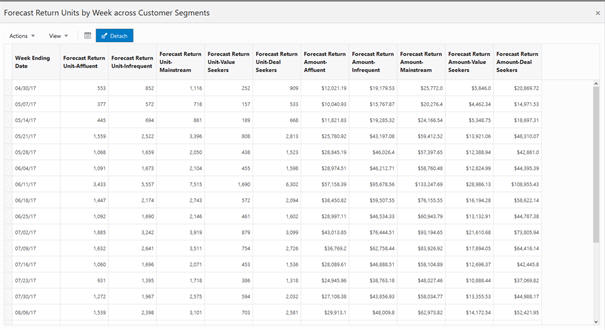
Table with forecast sales and returns by week, as shown in Figure 10-45, Figure 10-46, and Figure 10-47.
Displays the following additional metrics compared to the chart: forecast sales amount, forecast return amount, forecast return %, and item count by week for the selected merchandise and segment combination.
Table that compares returns metrics across merchandise, as shown in Figure 10-45, Figure 10-46, and Figure 10-48.
Displays the following additional metrics compared to the chart: forecast sales units, forecast sales amount, forecast return units, item count, sales life till date, returns life till date, and actual return percentage across all products for the selected merchandise and customer segment.
Use Manage columns to select the metrics displayed in the table. Use the Detach button to expand the table into a pop-up window for ease of use, as shown in Figure 10-47 and Figure 10-48.
The Customer Segment tab, shown in Figure 10-49, is used to compare the forecast returns trends across the various segments.
Use this tab to compare the forecast return units trends across various customer segments. Similar to Forecast Review and Returns Review tabs, you can view the customer segment comparison for the selected merchandise. The filtering functionality for merchandise works in the same way as in the Forecast Review and Returns Review tabs. In the chart, individual customer segments can be selected and un-selected by clicking the legend. The chart is rescaled automatically based on the new selection, as shown in Figure 10-50. Rescaling is useful for reviewing patterns for customer segments with low sales volume.
Figure 10-50 Rescaling Based on New Selection
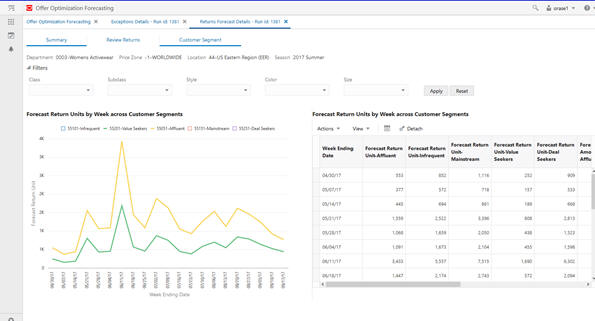
The table on the right displays the forecast return units and the forecast return amount for all customer segments. The Detach button can be used to expand the table into a pop-up window for ease of use, as shown in Figure 10-51.
Offer Optimization Forecasting supports exceptions based on sell thru and returns.This includes the following:
Sell thru exception. When the Sell thru end of life is lower than the sell thru exception threshold for any product.
Returns exception. When the Forecast return % is greater than the return exception threshold for any product.
The sell thru exception threshold and return exception threshold are set in the RSE_CONFIG table and are global settings. By leveraging these settings, you can identify products that display outlier behavior, review forecast and returns information corresponding to the product, and take appropriate action.
The Exceptions tile displays the following information across all OO runs for the next effective date:
The pie chart represents the count of products with sell thru exceptions and returns exceptions based on the optimal price changes recommended by the Offer optimization system for the effective date.The center content of the pie chart displays the percentage of items/products with exceptions across all runs for the earliest effective date.
The notification bar on the right displays the same information as the Exceptions tile for the most recent successful runs. For each run in the notification bar, the top left corner displays the run ID and the bottom left corner displays the location and department corresponding to the run.
The All Exceptions Overview table displays the run information corresponding to the run ID from Offer Optimization, along with additional metrics such as item count, forecast sales units, returns units, total buy, and projected end of life sell thru.
From the All Exceptions Overview table, you can select an individual run by clicking the run name. This opens up a new tab called "Exception Details - <Run Id: 1381>" with the following two sub-tabs: Summary and Review Exception.
The Summary tab provides a breakdown of the exceptions by class for the select run ID.
You can use the Review Exception tab to view all the products that satisfy the exception criteria. Use the filter selection to shortlist the products based on their merchandise hierarchy. The Review Exception table provides hyperlinks to the Review Forecast and Review Returns charts that correspond to the product for further analysis. Based on the analysis, you can add comments for every product that is shown in the exceptions. You can also flag the product. Both the comments and flag information from this screen are available in the Manage Recommendations screen within OO.
The Summary tab provides aggregate metrics by Class. It has the following two components:
Chart for Exception summary by class: Chart displays the count of sell thru exceptions and returns exceptions by class.Table for Exception summary by class. In addition to the count of exceptions displayed in the chart, the inventory value of the exceptions, product count, and inventory value of all products are present in the table. You can compare the inventory value of exceptions with inventory value of all items.
The Review Exceptions table displays all the products that satisfy either the sell thru or return exception criteria. By default, the table displays all the exceptions from the selections run, shortlist products based on the merchandise hierarchy by leveraging the filter criteria. By expanding the Filters icon you can see the available options for selecting a specific merchandise (in a similar manner to Review forecast and Review returns screen).
The forecast sales units and forecast return units columns in Exception review table act as hyperlinks to the Review Forecast tab and the Review Returns tabs that correspond to the product, as shown in Figure 10-54. These links are used to take the user directly to the corresponding product's information related for forecast and returns, as shown in Figure 10-55 and Figure 10-56. After reviewing the information, you can add comments for future reference using the Note icon under the Action column titled Action, as shown in Figure 10-57. The Action column also has a flag icon, which you can use to flag some of the exceptions, as shown in Figure 10-58. The comments and the flag information are passed to the Manage Recommendations screen in OO. For example, for a product with a sell thru exception, after reviewing the review forecast information, you may decide to override the price recommendation with a deeper promotion, since the model was restricted by the max first promotion business rule.
Manage columns can be used to select the metrics displayed in the table. The Detach button expands the table into a pop-up window for ease of use.
For the highlighted product, forecast sales units and forecast return units hyperlinks can be used to access the corresponding review forecast and review return screens.
Offer Optimization is integrated with a voice assistant such as Oracle Digital Assistant to handle complex workflow and business process questions. The functionality integrates voice assistants, machine learning techniques such as NLP, and a pricing solution such as Offer Optimization. This reduces the workflow for a typical user of such software and helps in handling complex business process use cases. For example, buyers or managers who manage price recommendations for retail apparel might be interested in use cases such as:
Chain/country-level view. For example, a user can ask to see the performance of a department or all departments at the country level.
Exception management. For example, a user can ask to see the locations for a department where the margin improvements are lower than 5%.
Approval process. A few use cases are possible. A user can approve all batch runs or select specific runs for approval. For example, a user can reject the price recommendations for runs that have a discount higher than 40% or approve all batch runs that show an improvement of 5% for revenue.
Recalculate the key performance metrics. For example, a user can reject recommendations that have a discount higher than 70% and recalculate the metrics.
Q&A. This integration helps in answering a user's most frequently asked questions. For example, a user can ask about promotions and the Q&A tab brings up the relevant questions and answers related to the term "promotions."
A user can enable the Oracle Digital Assistant by clicking the microphone symbol. A user can say a particular question (utterance) to a voice-enabled device, and the utterance is converted into text and mapped to an intent/entity using existing Natural Language Processing algorithms such as Oracle Intelligent Bots. Once the intent/entity has been identified, it is sent to a pricing solution such as Offer Optimization, which then performs the appropriate processes and returns information.
Some examples of the conversation for the above use cases are provided below. The user utterance is prefixed with "User" and the response from ODA is prefixed as "Bot."
Sample Conversation: Country-Level View for All Departments
User: "I would like to see how my stores in US are performing."
Bot: "Okay. It seems as if you want to take a look at the country-level metrics for stores. Please specify the location from the following: <America, Europe, E-commerce US>?"
User: "America."
Bot: "Do you want to review a specific department or all departments?"
User: "All departments."
Bot: "Aggregated metrics for the specified location(s) and all departments are: Revenue is 2756451.736, Change in Revenue is -1.49%, Gross Margin is 1868901.003, Change in Gross Margin is -3% , Sell Through is 0.6861, Change in Sell Through is 1.28%."
Sample Conversation: Country-Level View for Selected Departments
User: "I would like to see how my stores in US are performing."
Bot: "Okay. It seems as if you want to take a look at the country-level metrics for stores. Please specify the location from the following: <America, Europe, E-commerce US>?"
User: "America."
Bot: "Do you want to review a specific department or all departments?"
User: "Specific Department."
Bot: "Which department are you interested in?"
User: "Womens Activewear"
Bot: "Aggregated metrics for the specified location(s) and department(s) are: Revenue is 2756451.736, Change in Revenue is -1.49%, Gross Margin is 1868901.003, Change in Gross Margin is -3% , Sell Through is 0.6861, Change in Sell Through is 1.28%."
Sample Conversation: Exception Management
User: "I want to see the locations that do not meet the approval criteria."
Bot: "Okay. It seems as if you are interested in finding exceptions. First, which department are you interested in?"
User: "Womens Activewear."
Bot: "What metric are you looking for: Revenue Improvement, Margin Improvement, Sellthrough Improvement, or Sellthrough?"
User: "Sellthrough."
Bot: "Please specify the threshold (for example, 15%) for identifying the poorly performing locations."
User: "10%."
Bot: "The location for Department Womens Activewear with Sellthrough below 10% is Company."
Bot: "Would you like to see the run summary for this Department and the location?"
User: "Yes."
Bot: "The metrics for run Copy_Of_test are: Revenue is 2756451.736, Change in revenue is -1.49%, Gross Margin is 1868901.003, Change in gross Margin is -3% , Sell through is 0.6861, Change in sell through is 1.28%."
Bot: "Would you like to approve the run - Yes/No?"
Depending on what the user answers here, the flow will be different. If the user says "Yes," then the user is taken to the Approval Use Case. If the user says "No," then the user is taken to Recalculate Use Case.
Sample Conversation: Approval Use Case–Single Run
User: "I want to review the metrics and would like to take care of run approvals today."
Bot: "Okay. It seems as if you are interested in approving runs. Do you want to approve all batch runs or a single location?"
User: "Single location."
Bot: "Which location are you interested in?"
User: "Company."
Bot: "Which department are you interested in?"
User: "Womens Activewear."
Bot: "The metrics for the run Weekly Run 04242017 are: Revenue is 2756451.736, Change in Revenue is -1.49%, Gross Margin is 1868901.003, Change in Gross Margin is -3% , Sell Through is 0.6861, Change in Sell Through is 1.28%."
Bot: "Would you like to approve the run - Yes/No?"
User: "Yes."
Bot: "The run has been approved, and the offers have been sent to the customers."
Bot: "Please let me know how can I help you with the Offer Optimization application."
Sample Conversation:Approval Use Case–All Batch Runs
User: "I want to review the metrics and would like to take care of run approvals today."
Bot: "Okay. It seems as if you are interested in approving runs. Do you want to approve all batch runs or a single location?"
User: "All batch runs."
Bot: "Which department are you interested in?"
User: "Womens Activewear."
Bot: "All five batch runs have been approved."
Bot: "Please let me know how can I help you with the Offer Optimization application."
Sample Conversation: Recalculate Use Case
User: "I want to review the metrics and would like to see whether to make any changes to the recommendations."
Bot: "Okay. It seems as if you are interested in accepting or rejecting recommendations. First, which location are you interested in?"
User: "Company."
Bot: "Which department are you interested in?"
User: "Womens Activewear."
Bot: "The metrics for run Copy_Of_test are Revenue is 2756451.736, Change in revenue is -1.49%, Gross Margin is 1868901.003, Change in gross Margin is -3% , Sell through is 0.6861, Change in sell through is 1.28%."
Bot: "Would you like to approve the run - Yes/No?"
User: "No."
Bot: "Would you like to ACCEPT/REJECT available recommendations? - ACCEPT/REJECT."
User: "ACCEPT."
Bot: "Would you like to ACCEPT promotion/markdown recommendation? - PROMOTION/MARKDOWN."
User: "Promotion."
Bot: "What is the maximum percent discount criterion to accept Promotion recommendations?"
User: "40%."
Bot: "Promotion Price recommendations below 40% have been accepted."
Bot: "Would you like to recalculate the metrics again - Yes/No?"
User: "Yes."
Bot: "The run has been submitted for recalculating the metrics. To see the new metrics, please query the bot."
Bot: "Please let me know how I can help you next with the Offer Optimization application."