| Oracle® Retail Science Cloud Services User Guide Release 18.0.002 F17712-02 |
|

 Previous |
 Next |
This chapter describes the Size Profiles Cloud Service module.
The Size Profiles (SP) is a module under Retail Profile Sciences and is used to estimate the distribution of demand across different sizes (size profile) for different merchandise and location levels.
Size profile is estimated at different levels of merchandise and location. The lowest level of estimation is style-color (for merchandise) and store (for location). Size profiles may also be estimated at higher levels of aggregation on both the merchandise and location dimensions (for example, at subclass-store or style/color-store cluster) depending on the retailer's requirements. Irrespective of the level of estimation, the final output for size profiles is at lowest level (style-color/store) and size profiles are shown at the lowest level in the UI.
At a high level, the workflow for SP consists of creating a run, reviewing, overriding, and approving the output (that is, size profiles), and submitting the output to another user for further review or to a downstream application.
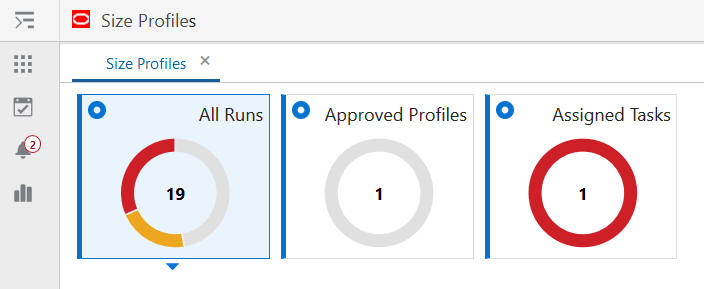
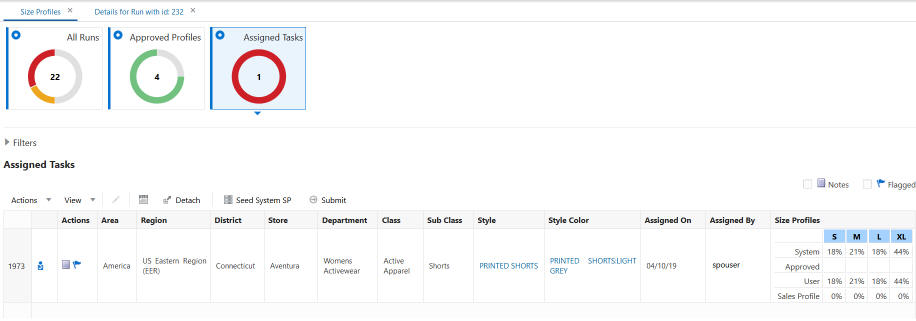
You can use the Info tiles at the top of the screen, shown in Figure 11-1, to navigate to:
All Runs, which displays all previously created runs.
Approved Profiles, which displays the approved profiles for all runs.
Assigned Tasks, which displays all profiles assigned to the user for review.
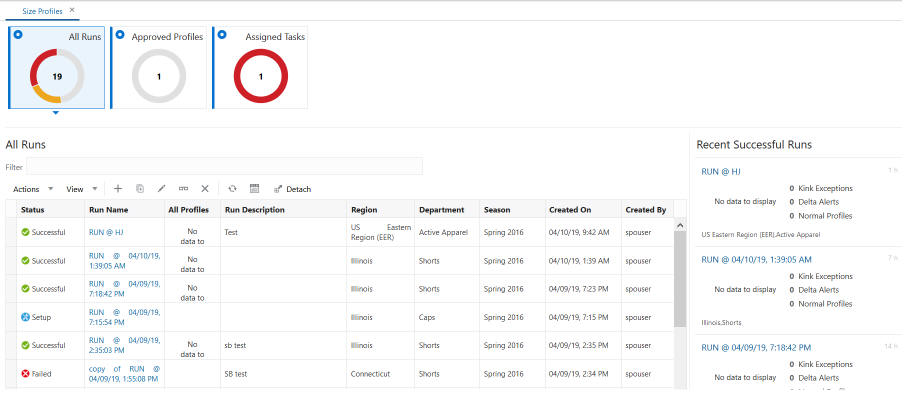
The All Runs screen, shown in Figure 11-2, lists all previously created runs, regardless of their status.
Click on the Run Name on any run with a status of Setup, In progress, or Successful, in order to open that run. The Output tab opens, as shown in Figure 11-7.
When you select a run with a status of Setup, you can modify the information and parameters for creating a run and complete the Create Run process, as described in "Creating a Run".
When you select a run with a status of Successful or In Progress, you see the run output tab, as described in "Run Output".
You can filter any of the columns by entering text into the filter bar.
The Recent Successful Run list is displayed in the contextual area on the right. You can also click on a run in this list in order to open it.
To estimate size profiles, you create a run and specify the settings to be used for the estimation. To begin the process, either click the Create icon at the top of the overview table or select a row in the overview table and click the Duplicate icon to duplicate a run. In either case, the Create Run screen is displayed, as shown in Figure 11-3.
Figure 11-3 Create Run Showing Information Tab
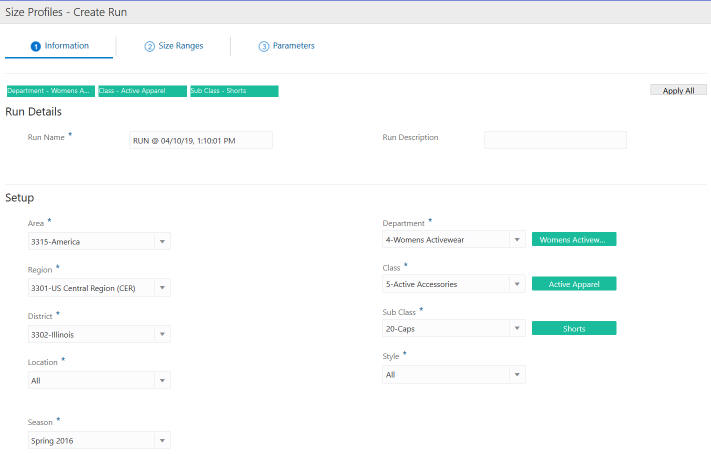
The Create Run screen has the following features:
Three tabs: the "Information Tab", the "Size Ranges Tab", and the "Parameters Tab".
The Save button, which saves the changes made in any of the tabs.
The Cancel button, which discards the changes in the current tab and closes the Create Run screen.
The Submit button, which saves all changes, begins the execution of the run, and closes the screen. At this point, the status of the run changes from Setup to In Progress.
The contextual area on the right, which displays a summary of user selections in each of the three tabs.
Use the Information tab, shown in Figure 11-3, to provide the run name and description in the Run Details section. Use the drop-down lists in the Setup section to select the products and locations that the size profile should be generated for. Select the season code for the time period for the analysis.
A size range consists of a set of all available sizes for each style-color. For example, the size range for the style-color of Men's Pullover Black and Store of Boston Downtown is S, M, L, XL. The size range data is provided by retailer.
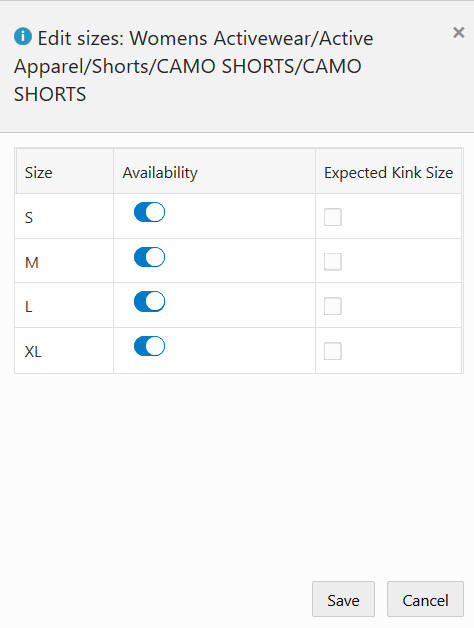
In the Size Ranges tab, shown in Figure 11-4, size range data is shown for each style-color and each store. If a certain size is not available in a size range, it will be shown as greyed out. If a size has been specified as an expected Kink Size (which means it is an odd size that may have significantly fewer or more sales than other sizes), it will be shown in blue.
Figure 11-4 Create Run Showing Size Ranges Tab
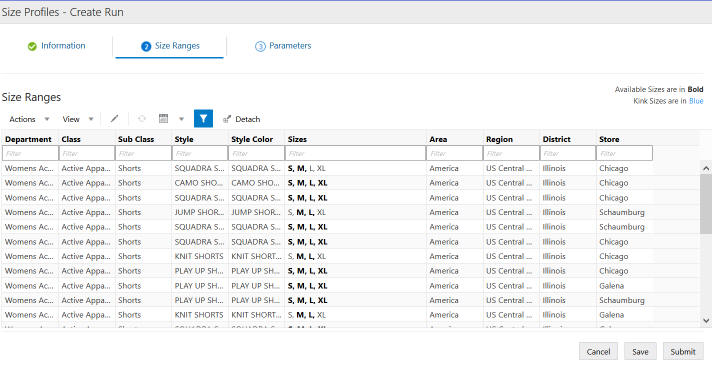
To edit the available sizes and kink size flags, select a row and click the Edit icon. This opens a pop-up, shown in Figure 11-5
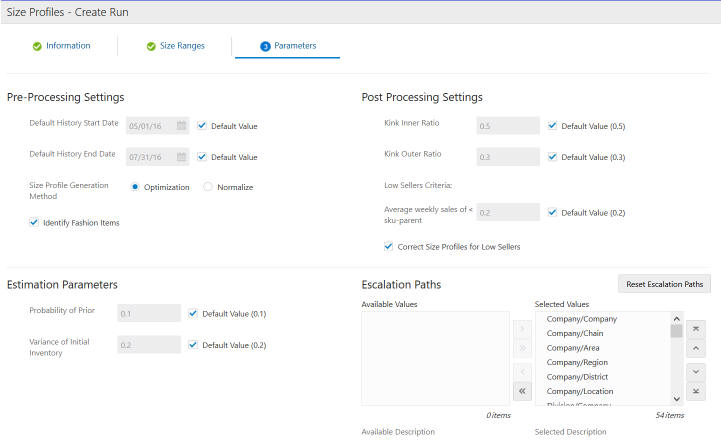
The Parameters tab displays the following parameters, which are used by the size profile generation algorithm. The escalation path is used to find the optimal size profiles associated with each style-color and store. When a size profile at a given level of the escalation path does not meet the post-processing criteria, it automatically gets rejected and the size profile associated with a higher level is examined. This process continues until a valid size profile is fond at one of the levels along the escalation path.
Pre-Processing Settings
Post-Processing Settings
Estimation Parameters
Escalation Paths
You can edit the values for these parameters, as shown in Figure 11-6.
Figure 11-6 Create Run Showing Parameters Tab
Once the run has completed successfully, you can review the size profile output. You can override and approve or un-approve size profiles at style-color/store level in the Output screen.
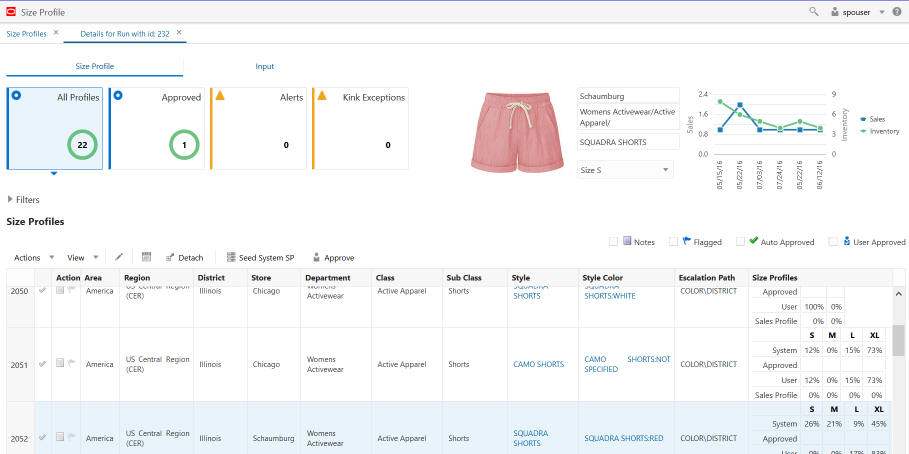
To open a run with a status of Complete, click the Run Name in either the All Runs table or from the list of recent runs, as shown in Figure 11-2. The Run Output screen opens in a new tab. This screen has two tabs, Size Profiles and Inputs, as shown in Figure 11-7.
The Size Profiles tab displays the generated size profiles for each style-color/store for a specific run. You can filter the profiles based on their approved and alert status using the three Info tiles at the top of the screen for All Profiles, Approved, Kink Exceptions, and Alerts.
Below the tiles, you can use the collapsible filter section to filter the size profiles based on product and location hierarchies. You can also use the check-box filters above the table to filter profiles by status (auto/user approved) as well a notes/flag.
Size Profiles Table
The size profiles table is multi-row selectable, using the Ctrl and Shift buttons. All rows can be selected at once by clicking on the top-left cell in the table. This table has the following columns:
The first column (with no header) shows the status of the profile. Values are user approved (  ), auto approved (
  ), not approved (
  ).
).
The action column has the note and flag icons. Values are some notes have been added (  ), no notes added yet (
  ), flagged (
  ), not flagged (
  ).
).
You can click on the note icon to view or edit the notes in a pop-up. You can also click the flag icon to flag or un-flag a size profile.
The columns that show the product and location hierarchy (for example, Zone, Store, Class, Style).
The escalation path that indicates the level at which the size profile has been generated.
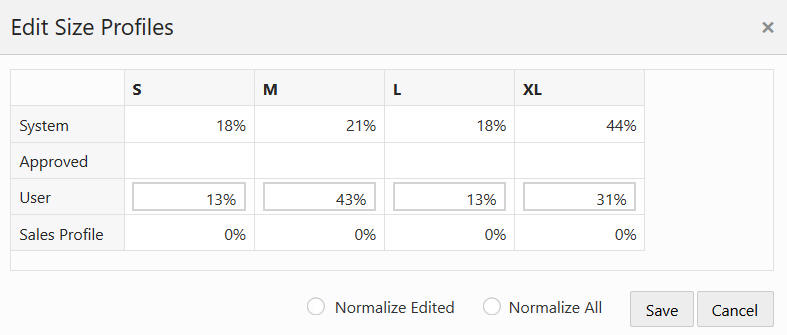
The size profiles chart shows the following values:
System: the size profile generated by the system (using the estimation algorithm)
User: the values edited by the user. If the user has not edited the values or has not seeded system values in order to populate user values, this row will be empty.
Approved: the approved values, if the size profile was approved. If the size profile has not been approved, this row will be empty.
Sales Profile: shows the profile of the observed sales (without estimating the lost sales and any other post-processing).
The following actions can be done in the Size Profiles table:
Seed the user values with the System size profile by selecting one, multiple, or all rows and clicking on the Seed System SP button at the top of the table.
Edit a profile in the edit pop-up by selecting a single row and clicking on the Edit icon at the top of the table. If a size profile is approved, edit is not allowed. To edit, the user must first un-approve the profile. The edit pop-up is shown in Figure 11-8. The edited values must sum up to 100 percent. If they do not, you will not be able to save. To normalize the values, you can use one of the two options (Normalize All or Normalize Edited). The first option adjusts all values so that they sum up to 100 percent. The second option adjusts only the edited values so that the sum of all the values becomes 100 percent.
Approve or un-approve a profile by selecting one, multiple, or all rows and clicking on the Approve/Un-approve button at the top of the table.
View and edit the notes on each profile using the Note icon in the Action column, which opens a pop-up.
Flag or un-flag a profile by clicking on the Flag icon in the Action column.
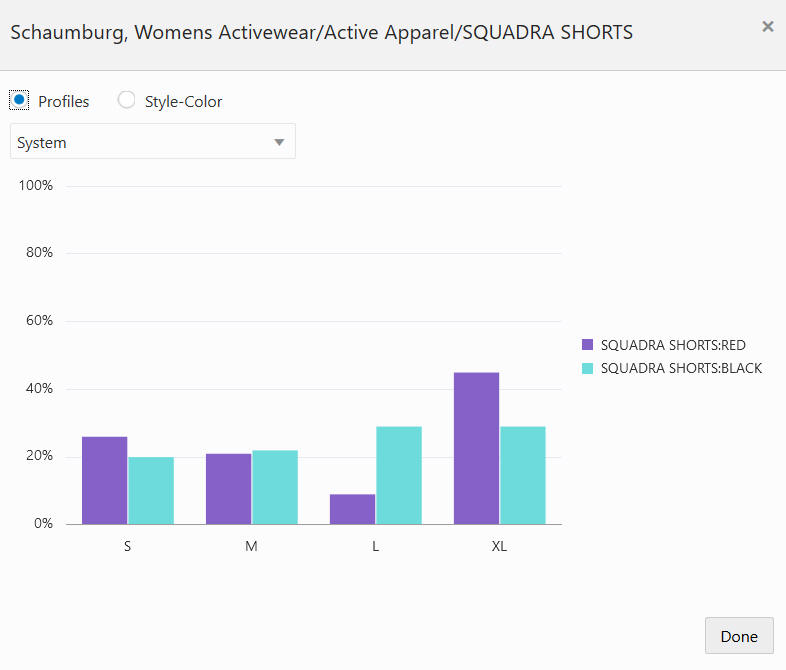
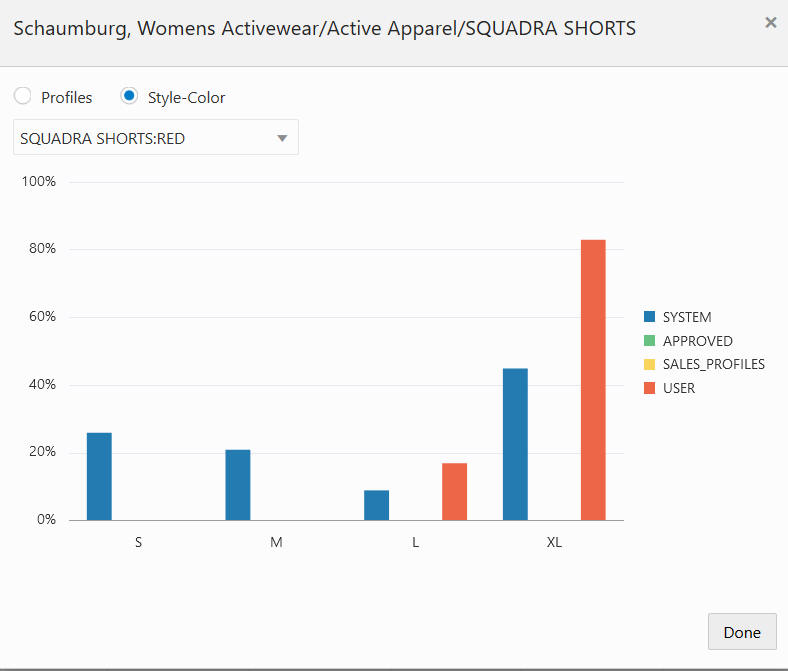
View the graphs for each profile by clicking on a hyper-linked style (which opens the graph pop-up and shows the Profile tab by default as shown in Figure 11-9), or by clicking on a hyper-linked color (which opens the pop-up and shows the Color tab by default as shown in Figure 10).
View the weekly sales and inventory and product image at the top of the screen for a selected row in the table.
|
Note: If a profile (for a given style-color/location) has already been submitted or sent for review, the seed, approve/un-approve, and edit actions are not available. None of these actions can be performed for the profile. Note and flag can still be modified. |
|
Note: If a user approves a profile for a given style-color/store that has previously been approved in another run, it will override the older run. As a result, the previously approved profile will become unapproved. |
The colors view shown in Figure 11-10, shows the four profiles (system, user, approved and sales profiles) for each color that is available within the selected style. You can select a different color from the drop-down list.
The profiles view shown in Figure 11-9 shows one of the profiles (system, user, approved or sales profiles) for all colors under the style. You can select a different profile from the drop-down list.
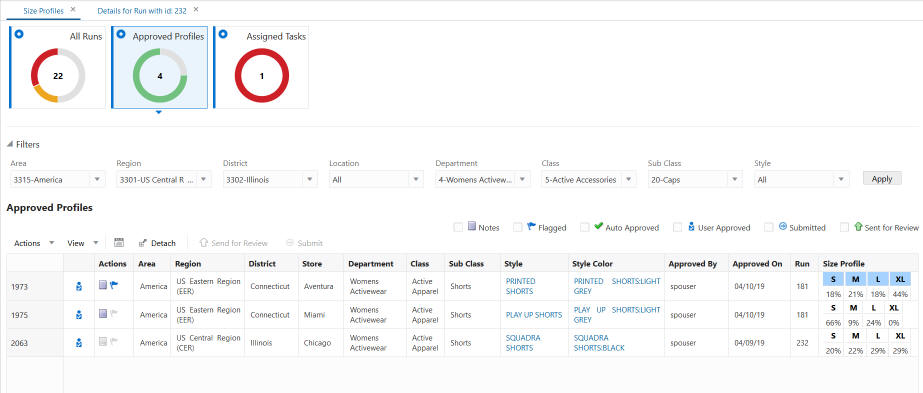
You can see all the approved profiles across all runs in the Approved Profiles screen. You can also select one or multiple profiles and send them for further review to another user. Alternatively, you can submit one or multiple profiles to a downstream application. Depending on your user role, you may only be able to send the approved profile for review, but not submit it for final export.
In the approved profiles screen, shown in Figure 11-11,you can view approved profiles across all runs.
The Filters section is the same as the one in the Run Output screen. You can use it to filter the size profiles based on product and location hierarchies. You can also use the check-box filters above the table to filter profiles by status (auto/user approved, submitted, and sent for review) as well a notes/flag.
The approved profiles table is multi-row selectable, using the Ctrl and Shift buttons. All rows can be selected at once by clicking on the top-left cell in the table. This table has the following columns:
The first column (with no header) shows the status of the profile: Value are user approved ( ), auto approved ( ), submitted (  ), sent for review (
  ).
).
The action column has the note and flag icons. Values are some notes have been added ( ), no notes added yet ( ), flagged ( ), not flagged ( ).
You can click on the Note icon to view or edit the notes in a pop-up. You can also click the Flag icon to flag or un-flag a size profile.
Columns that show the product and location hierarchy (for example, Zone, Store, Class, Style).
The escalation path that indicates the level at which the size profile has been generated.
Approved by, Approved on, and Run (on which the profile was approved).
Size profiles shows the approved profile.
The following actions can be performed in this screen:
View and edit the notes on each profile, using the Note icon in the Action column that opens a pop-up.
Flag or un-flag a profile by clicking on the Flag icon in the Action column.
Send a profile for review to another user role, using the Send for Review button above the table. It will open a pop-up in which you can select the reviewer role.
If a profile has been submitted, it cannot be sent for review again.The button will be disabled for submitted profiles.
Submit the profile to be used by other applications using the Submit button above the table.
If a profile has been sent for review, it cannot be submitted again. So the button will be disabled for 'sent for review' profiles.
View the graphs for each profile by clicking on a hyper-linked style (which opens the graph pop-up and shows the Profile tab by default as shown in Figure 11-9), or by clicking on a hyper-linked color (which opens the pop-up and shows the Color tab by default as shown in Figure 11-10).
In the Assigned Tasks screen, shown in Figure 11-12, you can see any profile that has been assigned to you for review by another user.
The filters section is the same as the one in the Run Output screen. You can use it to filter the size profiles based on product and location hierarchies. You can also use the check-box filters above the table to filter profiles by status (auto/user approved, submitted, and sent for review) as well a notes/flag.
The assigned tasks table is multi-row selectable using the Ctrl and Shift buttons. All rows can be selected at once by clicking on the top-left cell in the table. This table has the following columns:
The first column (with no header) shows the status of the profile: Values are user approved ( ), auto approved ( ) as well as icons for notes ( ) and flag ( ). User can click on the note icon to view the notes in the opened pop-up. Note is not editable. The flag icon indicates whether the profile has been flagged by the sender user or not. The profile cannot be flagged or un-flagged in the assigned tasks screen.
The columns that show the product and location hierarchy (for example, Zone, Store, Class, Style).
The escalation path which indicates the level at which the size profile has been generated.
Assigned on indicates the date the profile was approved on.
Assigned by indicates the user who approved the profile.
Size profiles chart that shows the following values:
System: the size profile generated by the system (using estimation algorithm)
User: the values edited by the user. Initially this row shows the values edited by the sender user (if any edits has been made).
Approved: the values that were approved by the sender user.
Sales Profile: shows the profile of the observed sales (without estimating the lost sales and any other post-processing).
The following actions can be performed in this screen:
Seed the user values with System size profile, by selecting one, or multiple, or all rows and clicking on the Seed System SP button at the top of the table.
Edit a profile in the edit pop-up, by selecting a single row and clicking on the Edit icon at the top of the table.
Submit the profile to be used by other applications, using the Submit button above the table.
View the notes on each profile, using the in-line Note icon. Notes are not editable.
View the graphs for each profile by clicking on a hyper-linked style (which opens the graph pop-up and shows the Profile tab by default as shown in Figure 11-9), or by clicking on a hyper-linked color (which opens the pop-up and shows the Color tab by default as shown in Figure 11-10).