| Oracle® Retail Science Cloud Services User Guide Release 18.0.002 F17712-02 |
|

 Previous |
 Next |
Innovation Workbench (IW) is a service that enables you to access read-only ORASE data using Oracle APEX and implement algorithms and analytics as an extension. This extension is a workbench for advanced analytics users that can be used to add new implementations via Oracle Advanced Analytic (Oracle R/ODM) algorithms that are implemented as SQL/PLSQL functions.
Innovation Workbench allocates a workspace to a retailer. This is a logical work area that is associated with a pre-allocated retailer database schema.
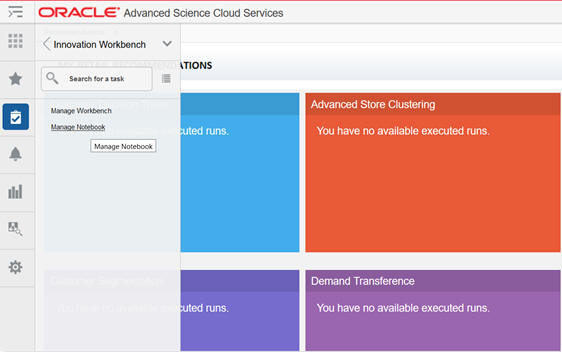
Figure 13-1 Accessing Innovation Workbench
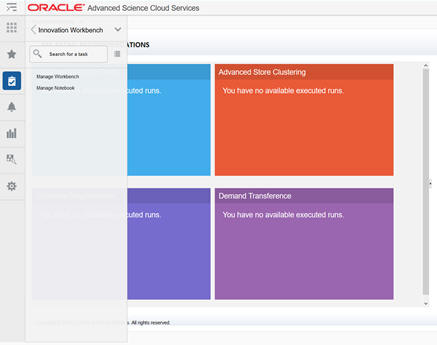
To access the workbench, in the Task menu shown in Figure 13-1, click Innovation Workbench. You see a list of workspaces in a new browser tab that are pre-allocated to the retailers you have access to.
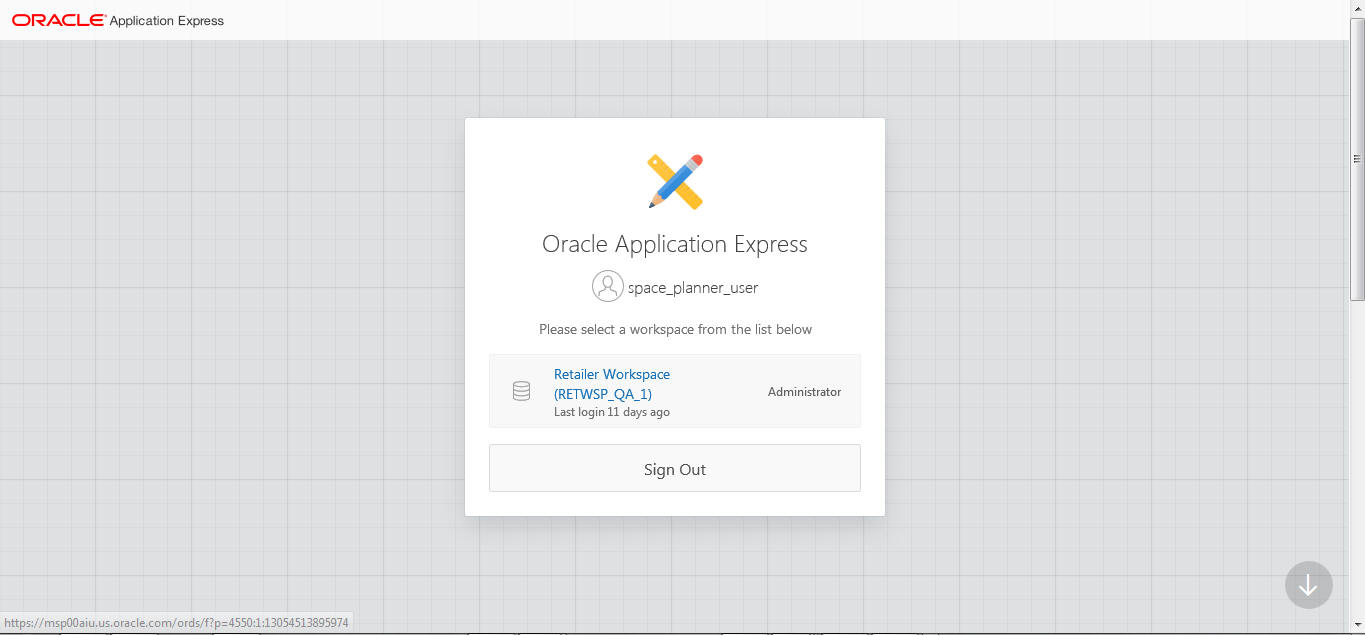
The Workspace List displays all the workspaces that you were initially assigned to when workspaces were created at the time of installation and configuration. You can select a workspace from the list to review database objects using Oracle Application Express, shown in Figure 13-2.
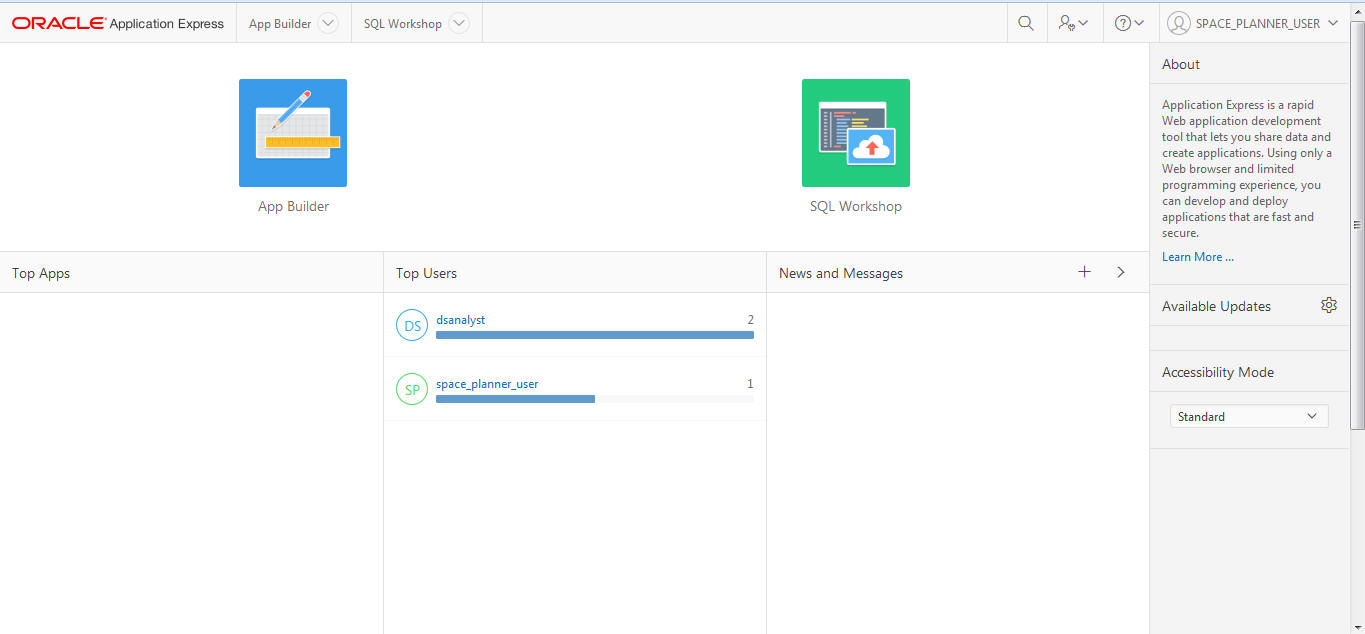
Figure 13-3 shows the Oracle APEX workspace, which displays SQL Workshop and App Builder.
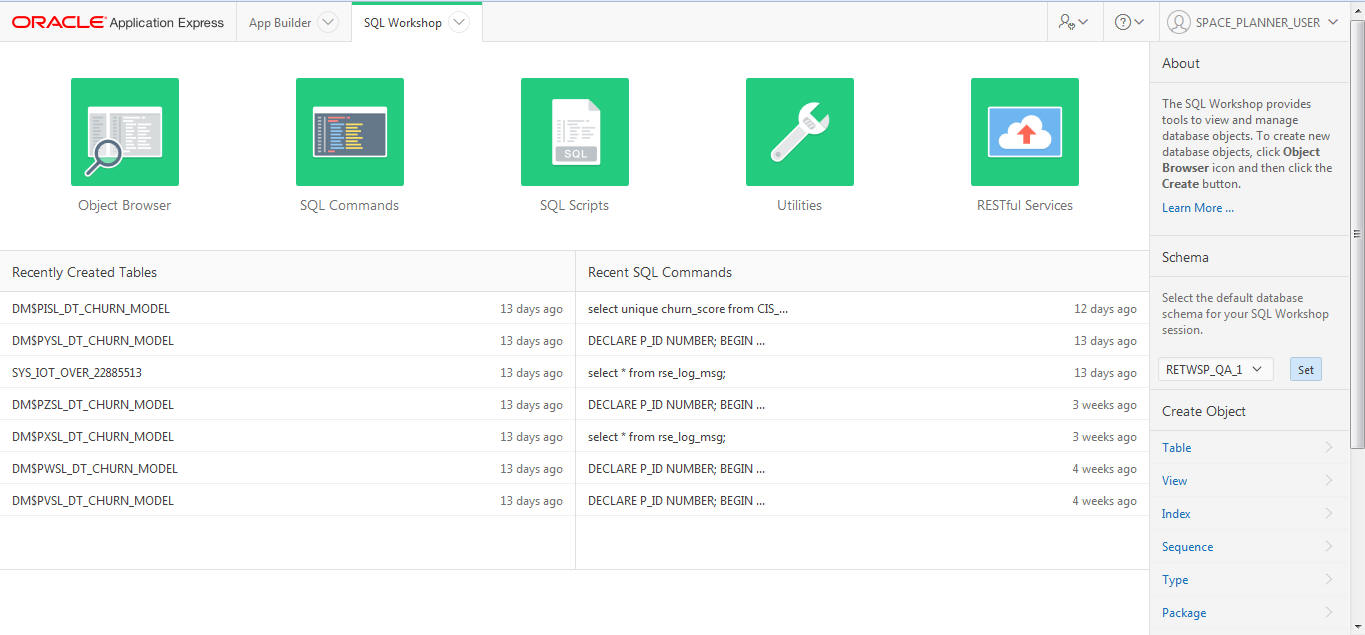
The SQL Workshop shown in Figure 13-4 provides tools to view and manage database objects.
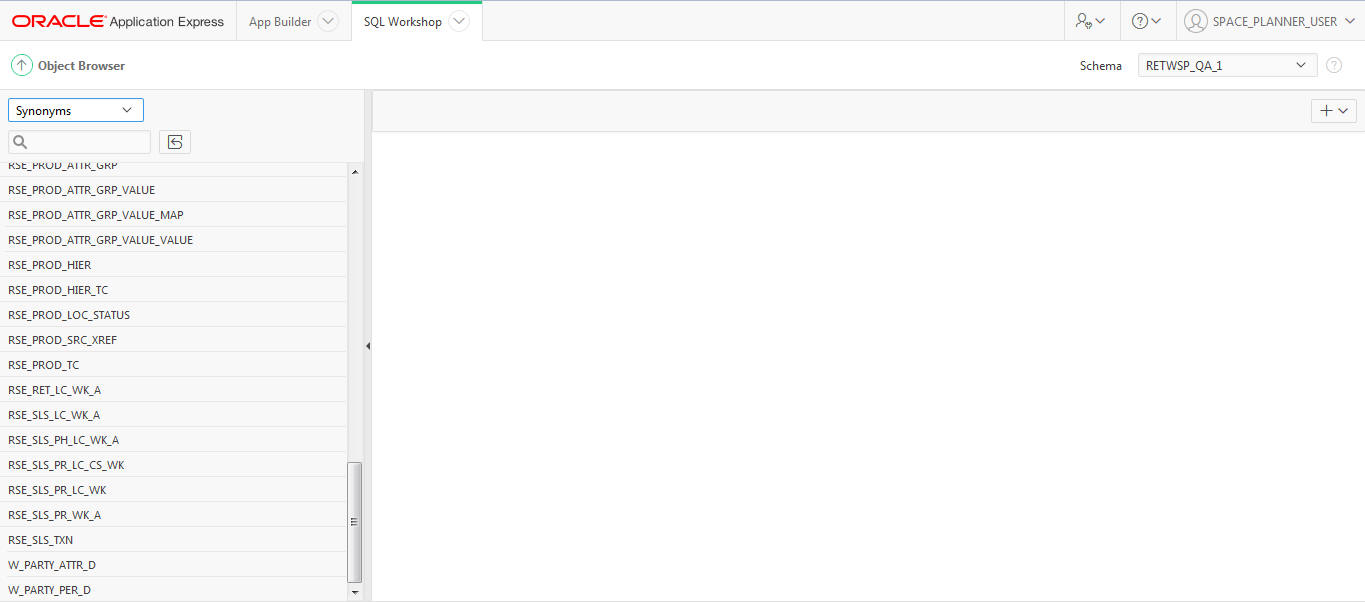
The Object Browser shown in Figure 13-5 lets you to use a tree control to view object properties and create new objects. The read-only ORASE database objects that are aggregated and cleansed are available for you to review and organize for data mining. Figure 13-4 shows the schema associated with the Retailer Workspace schema.
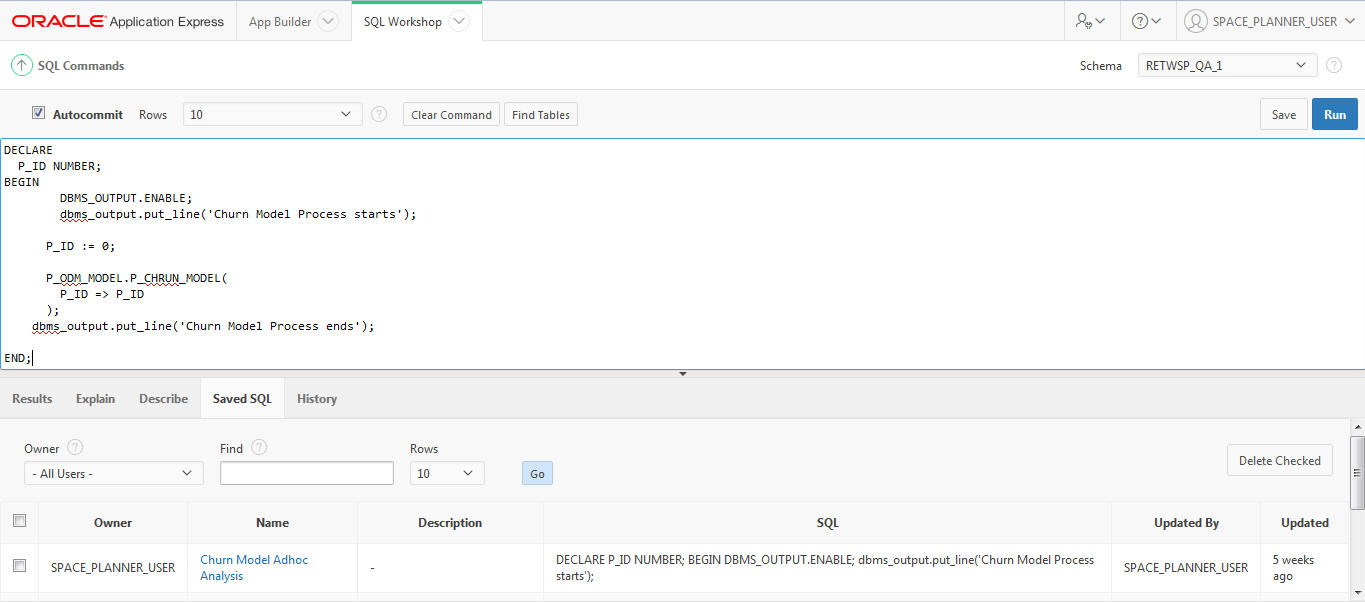
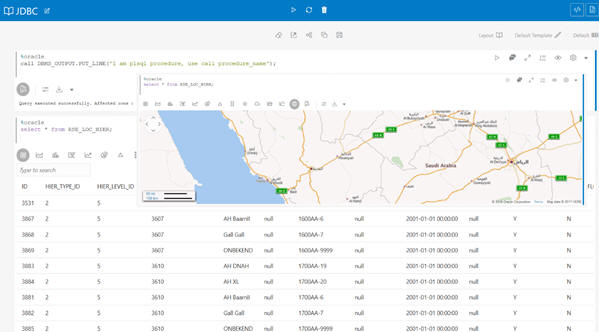
You can use the SQL Commands tool to enter ad-hoc SQL. The Query Builder can be used to create join queries using drag and drop. Figure 13-6 shows how to execute the ad hoc PL/SQL block.
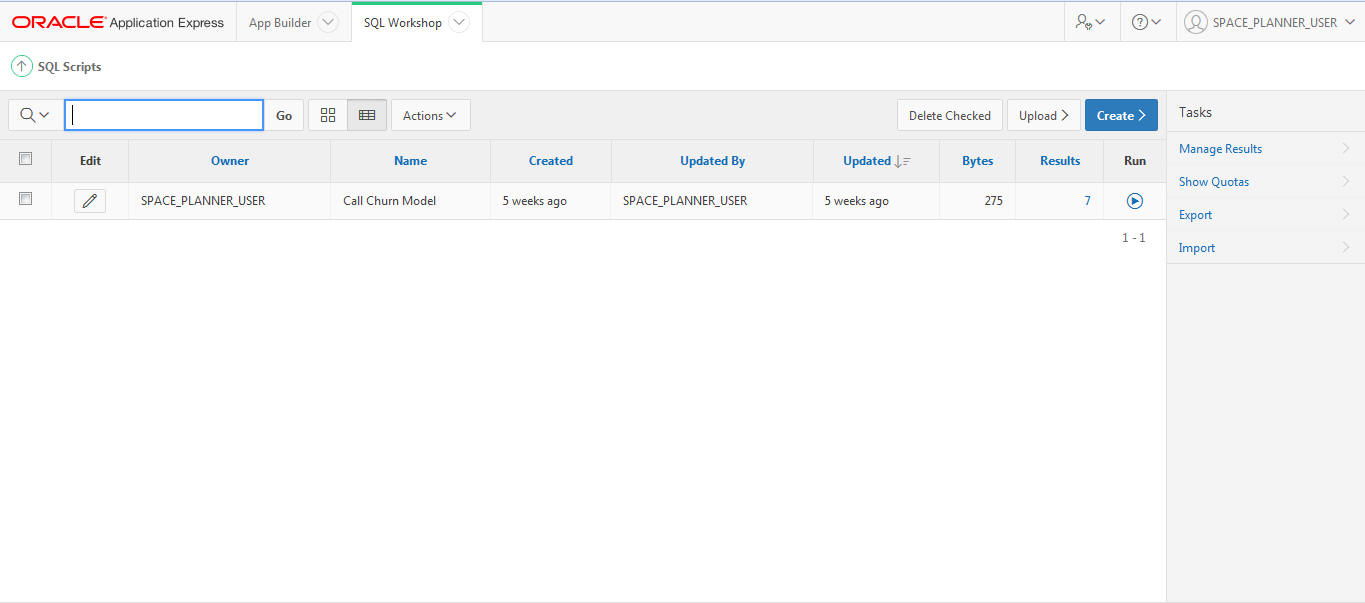
The SQL Scripts shown in Figure 13-7 can be used to store and run scripts. Use the Data Workshop to load and unload text, DDL, and spreadsheet data.
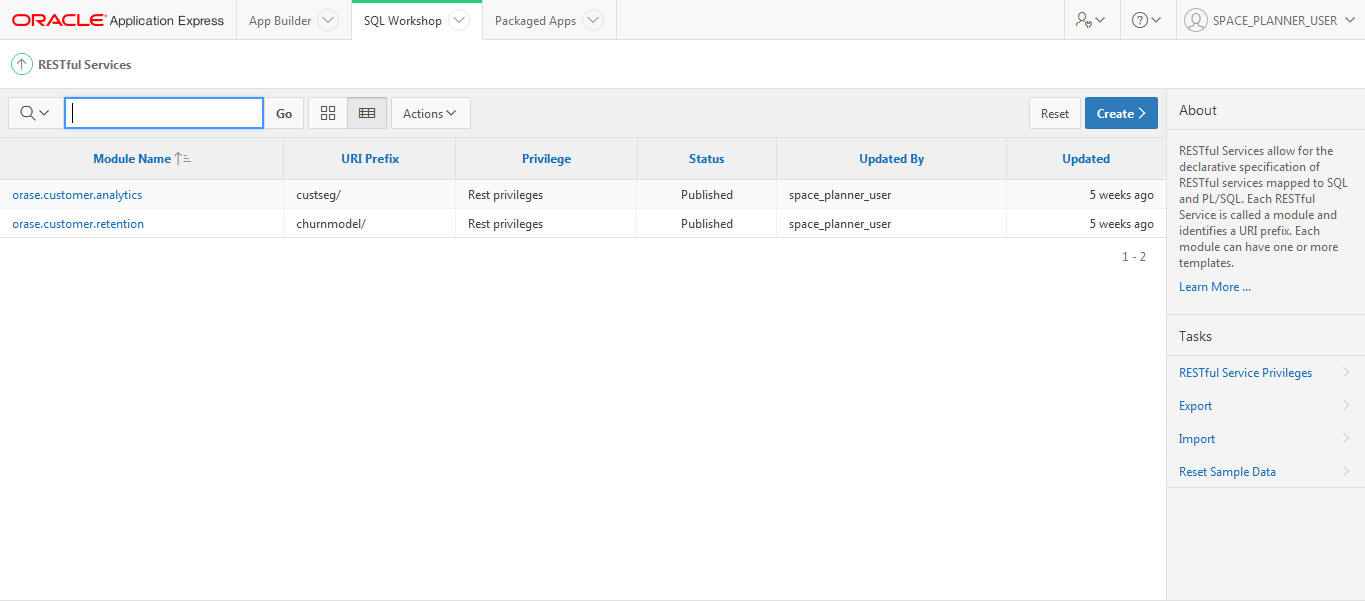
Use RESTful Services to manage web service definitions declaratively using SQL Query and to test the service modules from the web browser. Figure 13-8 shows a list of RESTful service modules.
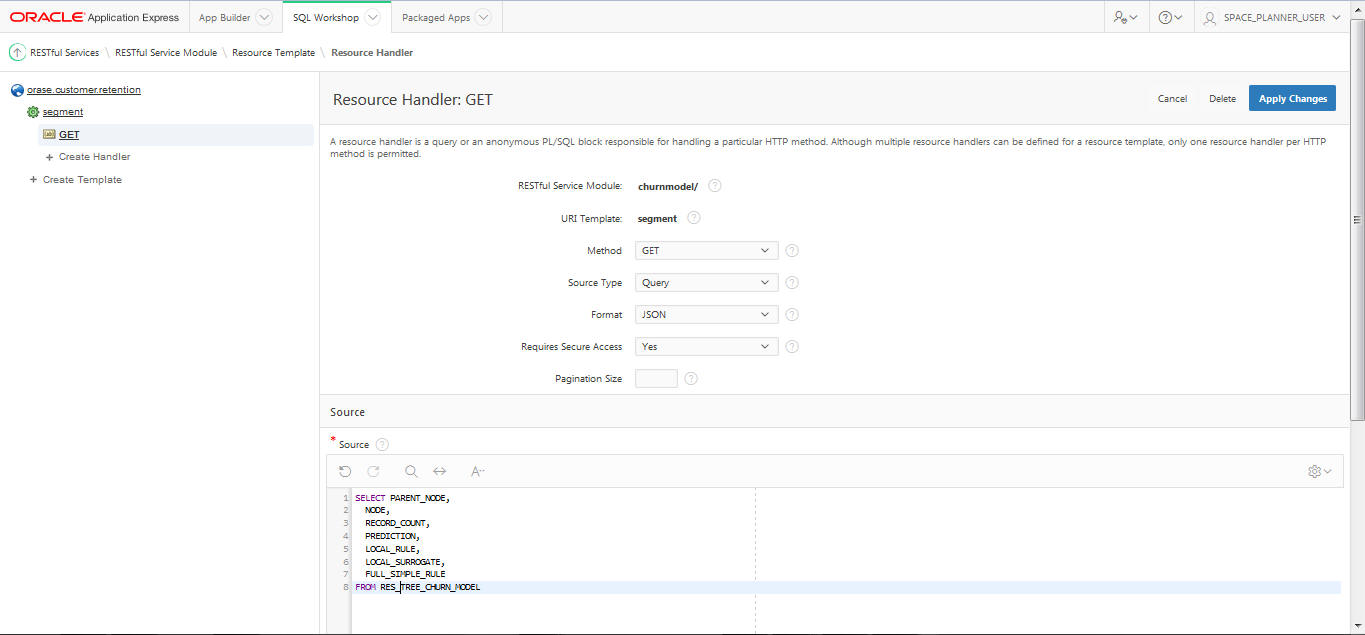
You can create a new RESTful Service module by clicking Create and setting the resource handler with a query or an anonymous PL/SQL block responsible for handling a particular HTTP method.
APEX SQL Workshop Guide is available at http://docs.oracle.com/database/apex-5.1/AEUTL/toc.htm">>http://docs.oracle.com/database/apex-5.1/AEUTL/toc.htm
Application Builder is a development environment that you can use to build and deploy database-centric applications. You can create interactive grids, reports, and charts.
APEX App Builder User's Guide is available at http://docs.oracle.com/database/apex-5.1/HTMDB/toc.htm">>http://docs.oracle.com/database/apex-5.1/HTMDB/toc.htm
You can use wizards to declaratively assemble database applications organized by page to visualize and explore data, as a pre-process or post-process of data mining.
The following functionality is available.
Create
Launches the Create Application Wizard, which you can use to build a complete application containing multiple pages.
Import
Launches the Import Wizard, which you can use to import export files from the export repository.
Dashboard
Links to the App Builder Dashboard, which displays metrics about applications in the current workspace.
Workspace Utilities
Use the Workspace Utilities page to manage App Builder Defaults, news items displayed on the home page, workspace themes, and so on.
Data scientists can use the Innovation Workbench Notebook to create notebooks, which are collections of documentation, snippets of code, and visualizations. These notebooks are bundled with key python modules for machine learning, data mining, natural language processing, network analysis, and optimization solvers. Interactive graph visualization is available that supports highlighting, expansion, and applying filters. Custom paragraphs for advanced graph visualization concepts such as visual graph creation and large graph visualization concepts are supported. This powerful widget concept allows the analyst to curate data into a form that is easier to understand, highlights trends and outliers, and shares reports with business.
The key features of Manage Notebook include:
Create, import, export, and clone python notebooks
Browse, filter, and search for Notebooks.
Add comments from the user interface (UI)
Visualize data in the form of a Graph Visualization.
Use collection of Python Libraries bundled with the product
Machine Learning packages such as (Tensorflow, Mxnet and Keras) Analyze
Optimization Solvers such as Gurobi
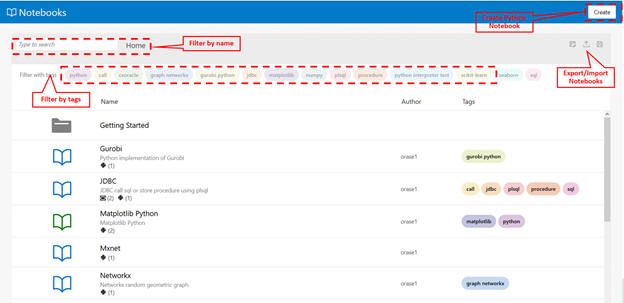
To access Python Notebook, click Innovation Workbench Manage Notebook. This opens a new tab in the browser and all the notebooks in the workspace are displayed.
From the workspace, you can import or export notebooks, create new workbooks, or copy notebooks. You can also browse, filter, and search for Notebooks using either a name or tags.
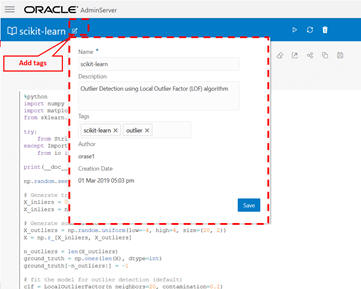
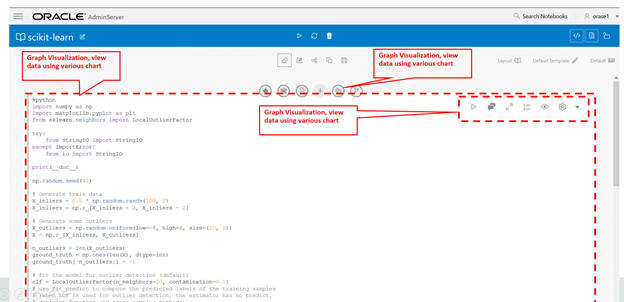
You can create a notebook and add paragraphs using the toolbar. These paragraphs can be Python, JDBC, Markdown, or graph analytics paragraphs. You can execute paragraphs individually and see the results at the bottom of each paragraph. You can also execute all the paragraphs from the toolbar provided at the top.
Figure 13-12 Notebook - Adding Paragraphs
You can associate tags with the Notebook; these tags can be used for filtering and browsing the notebooks.
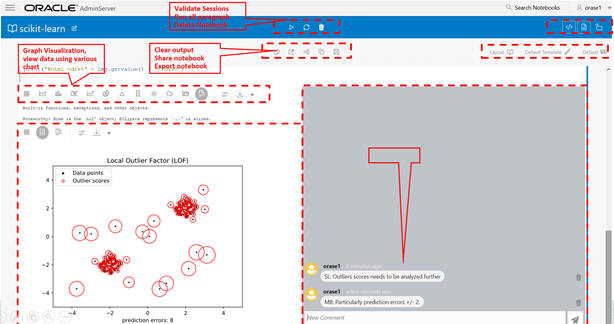
You can also add comments to the paragraphs and manage them from the user interface (UI). The comments can then be shared with others as a PDF. The Comments view shows all paragraph comments. You can visualize data in the form of a Graph Visualization and Exploration. You can explore graphs visually from within the notebook by viewing a summary of graphs or by using interactive exploration such as dragging, hovering, filtering, highlighting, and setting visualization properties. Different types of charts and graphs can be used for different types of datasets such as Line, Tag-Cloud, Tree Map, Scatter Plot, and so on.
You can visualize data in the form of a map and configure a column from a dataset to represent the latitude, longitude, title, and description.