Portfolio budget curves are part of the Cost Manager function. You can view these budget curves from the Cash Flow node of the Cost Manager. Before you can view them, however, you must add these curves to your project/shell. For instructions on adding these curves, see Add a Portfolio Curve
There are three of them:
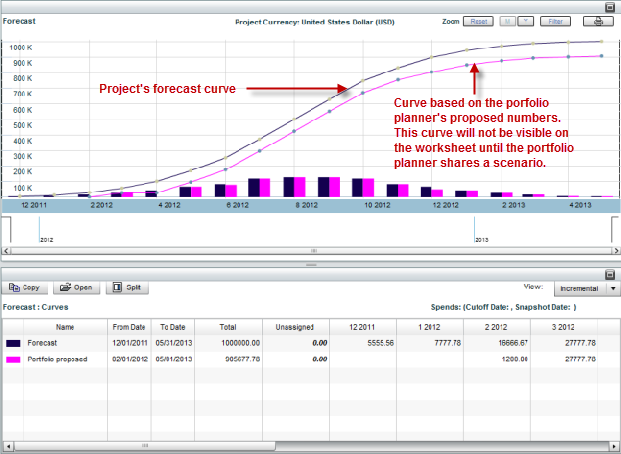
- A Shared Budget curve. This curve shows your proposed numbers for the project. The project manager will not have access to this curve until you share a scenario. The project manager can include this curve on the cost worksheet, along with the forecast budget, or any other budget curve, in order to see the difference between the project’s numbers and your proposed budget numbers.
- An Approved Budget curve. When a scenario is approved in the Portfolio Manager, the budgets for each project in the scenario are marked "approved." They are then locked and stored in the Portfolio Manager. An Approved Budget curve shows the approved budget for the project for that planning period (usually a year).
- An Original Budget curve. This curve is for a project in execution. This budget is the last approved budget for the project before it moved into its execution phase. This approved budget becomes the project’s original budget; and this original budget, plus any changes that occur to the numbers during the life of the project, becomes the project’s approved budget.
For example, an approved budget for the year 2015 might include a planned project for road construction that is scheduled to begin in 2017 with a budget of $100,000. The approved budget for the year 2016 will continue to include the planned road construction budget, with an addition of $15,000 to the forecasted budget. In the year 2017, the road construction project goes into execution, and the approved budget is $115,000. This figure becomes the original budget for the road construction project. From then on, as budget forecasting continues, the approved budget for the road construction will be the original budget, plus any changes that occur to the numbers during the life of that project.