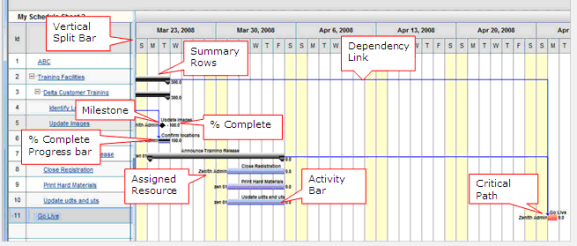
The Gantt Chart is displayed in the right pane of the schedule sheet. The activities are shown as bars and align with activities in the left pane. The activity bar is drawn with the start date, finish date, and duration elements of the activity. The Gantt chart is shown in week/day zoom mode by default.
The Gantt chart displays:
- Activity bars, which illustrate start and finish dates and duration
- Dependency links between dependent activities
- Summary rows
- Milestones
- Critical paths
The Gantt chart is interactive. You can:
- Zoom in or out of the Gantt chart view to display detail or overview of scheduled activities.
- Configure activity bar labels; for example, you can display percent complete to monitor the progress of activities, or names of resources assigned to activities, or virtually any activity property. See Gantt Chart tab of the Schedule Sheet Properties.
- Increase and decrease activity schedule durations by dragging on bar ends.
- Move activities from one time frame to another (modifying start and end dates).
- Add or remove a predecessor (dependency). See Dependencies tab of the Activity properties.
- Resize Gantt window by dragging the vertical split bar.
- Display critical paths.
The Gantt chart is refreshed automatically when any changes are made on the activities.
Understanding the Gantt chart view
Zoom in or out of the Gantt chart
You can view the Gantt chart by week (per day), month (per week), or year (per month) by zooming in and out. This allows you to view the Gantt chart in detail or over an extended period of time.
To zoom in or out of the Gantt chart
- Open the schedule sheet.
- Do one of the following:
- Click the Zoom In button on the toolbar. The default view is weekly, with each day of the week displayed. This is the maximum detail level that you can zoom in to the schedule sheet.
- Click the Zoom Out button. You can zoom out to view the Gantt chart by month with each week in the month displayed, or by year with each month displayed.
View the critical path
The critical path calculation can be used to flag activities on the schedule that, if delayed, can cause the schedule to go beyond the pre-planned project or shell end date. Therefore, it is important to have fixed project or shell start and end dates defined for the project or shell. Project or shell start and end dates should not automatically adjust as activities are added or rescheduled.
To view the critical path
- Open the schedule sheet.
- Click the View menu and choose Critical Path.
The activities that are on the critical path will change to red on the Gantt chart. The critical path action will also update the system-defined data element uuu_float to zero if it has been included on the activity attributes form (Activity Properties window).
- To restore the Gantt chart view, click the View menu and choose Gantt Chart.
View a tracking Gantt chart
A tracking Gantt chart allows you to compare two sets of dates for a specific activity. It allows you to track activity progress against the original plan. For example, the tracking Gantt chart allows the comparison between two sets of dates such as baseline and actuals. Users with view permissions can view a tracking Gantt chart. See Set Schedule Sheet Baselines for details on setting baselines.
The tracking Gantt chart is view only. It is not interactive like the regular Gantt chart.
To view a tracking Gantt chart
- Select the schedule sheet in the log and choose View > Tracking Gantt.
- You can switch back to the regular Gantt chart by choosing View > Gantt.
The tracking Gantt chart displays the data elements as a set of two bars (upper and lower) that allow you to make the comparison.