Creating Simplified Analytics
Click the Add Analytics button from the Unified Related Content Analytics pane on the right of an application page to open the Create Analytics Wizard. The Add Analytics button is visible if the PeopleSoft administrator has enabled analytics on the component,
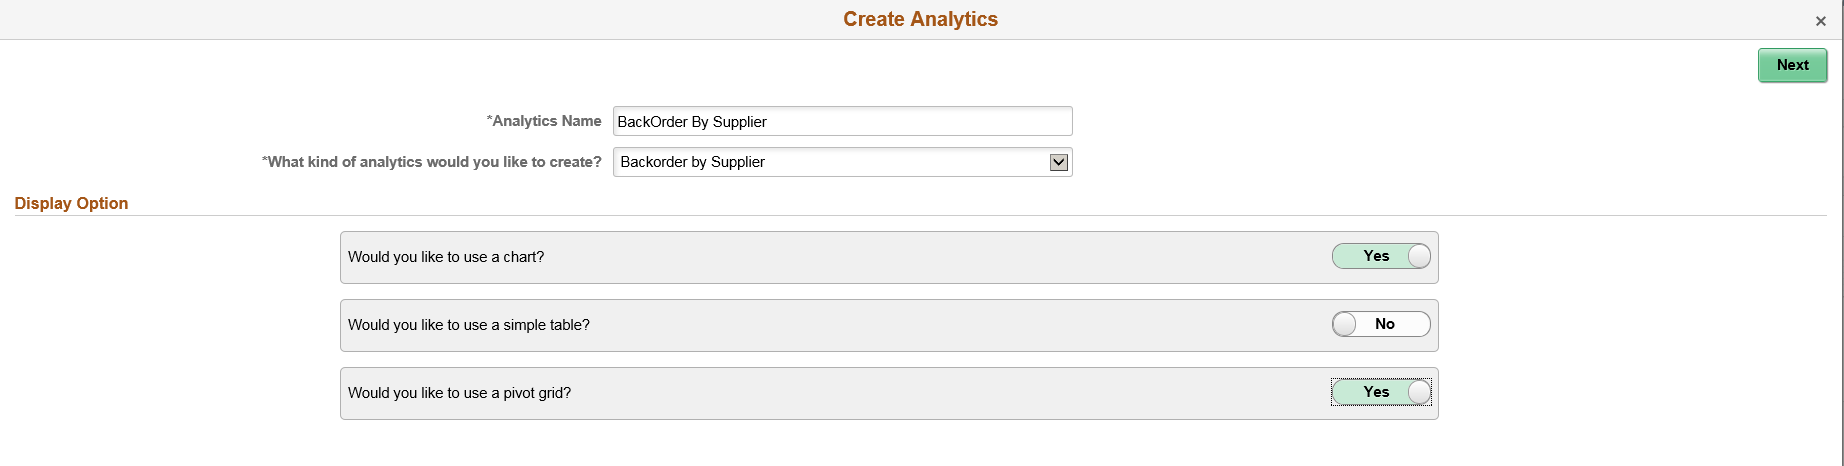
Use the Create Analytics Wizard - step 1 (PTPG_REPORT_WIZ_1) to specify the names of the analytic reports, select the analytic report template and select the display options that will be used to create the analytic report.
Image: Create Analytics Wizard - step 1
This example illustrates the fields and controls on the Create Analytics Wizard - step 1. Definitions for the fields and controls appear following the example.
|
Field or Control |
Definition |
|---|---|
| Analytics Name |
Enter a name for the analytic report. |
| What kind of analytics would you like to create? |
Displays the available analytic templates that are used to create the analytic report. The template you select from this list determines the fields and prompts in the next step of the wizard, Create Analytics - step 2. Note: This dropdown list is not available when only one template is available. |
| Display Option |
Define the display options for the analytic reports. The available options and combinations are:
|
| Next |
Click to advance the wizard to the next page. |
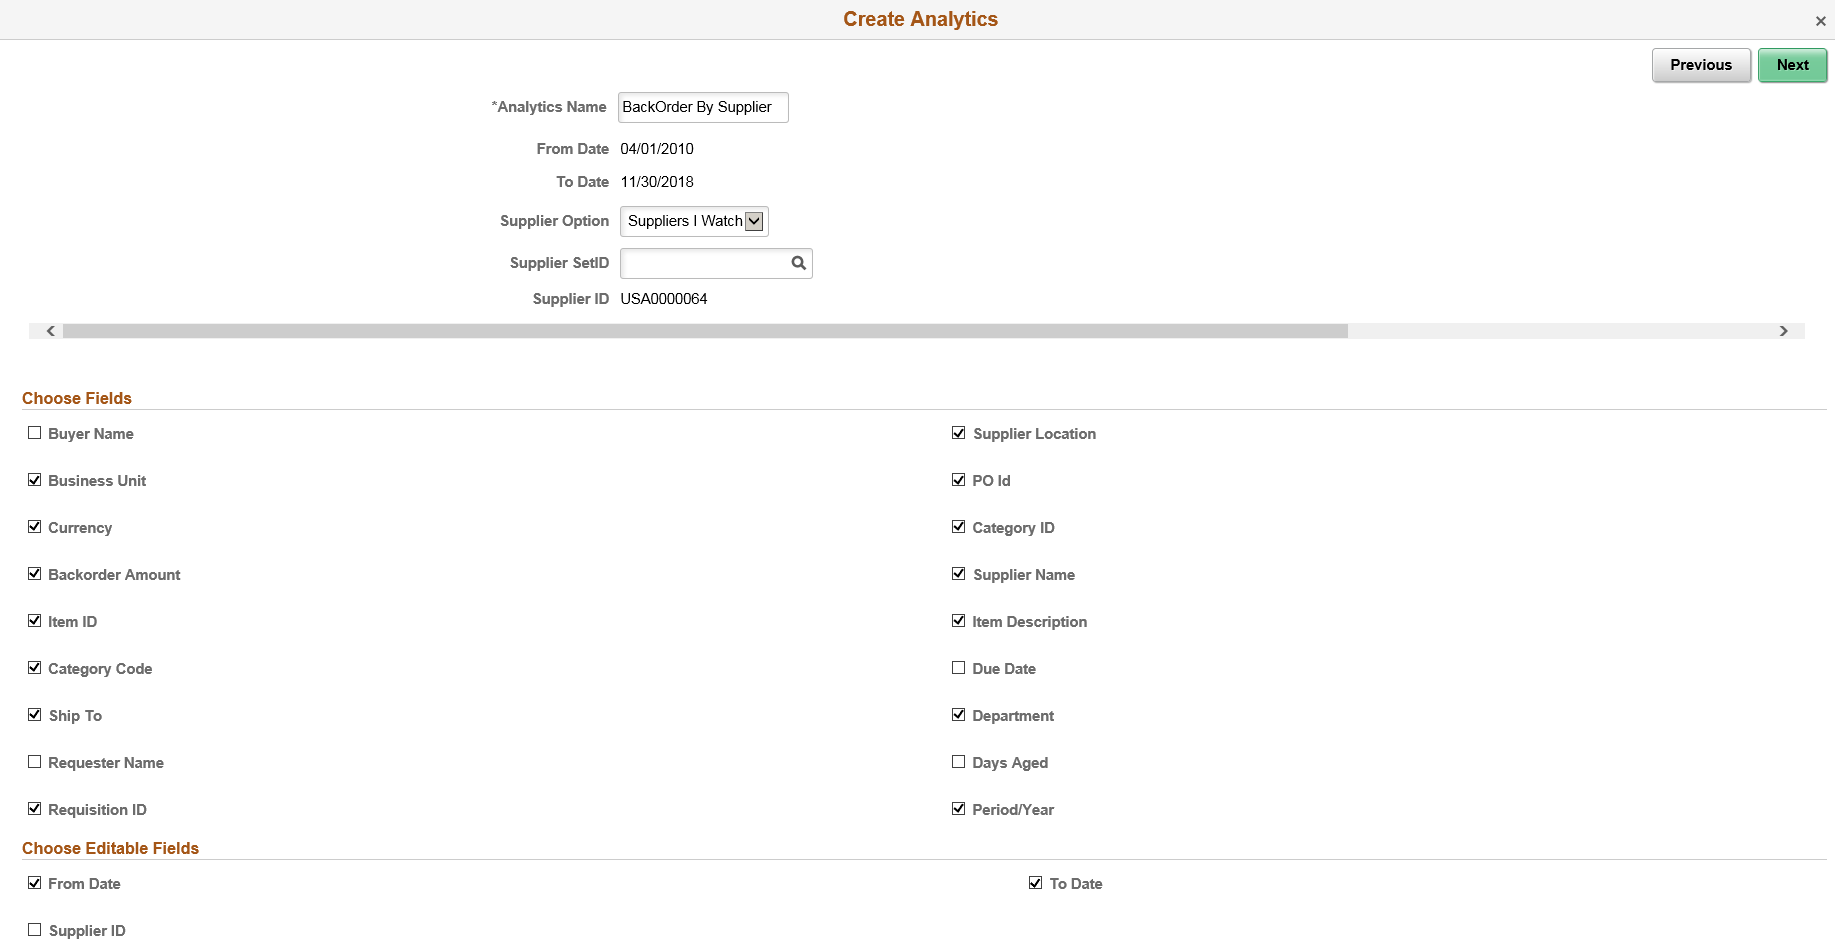
Use the Create Analytics Wizard - step 2 (PTPG_REPORT_WIZ_2) to select the fields for the analytic reports and to change the default values of the prompt fields.
Note: This page displays only the prompts that are set to Visible in the base report template.
Image: Create Analytics Wizard - Step 2
This example illustrates the Create Analytics Wizard - step 2. Definitions for the fields and controls appear following the example.
|
Field or Control |
Definition |
|---|---|
| From Date, To Date,Supplier OptionSupplier SetIDSupplier ID |
These options are based on the parameters set in the Related Content configuration. These prompts are defined in the Pivot Grid base template model. Note: The Supplier field is read-only because the value for this field is implicitly passed from the transaction page because of the related content configuration. |
| Choose Fields |
Use this section to select the fields that will appear in the analytic reports. Fields which are used as dimensions on the base model of the analytic are already selected. |
| Choose Editable Fields |
Select fields which you can modify during runtime. A user can change the prompt values to gain more insight into the analytics. |
Runtime Prompts
Map a prompt field as a page field so that the value is taken from the page context, in this case context of the analytic. The PeopleSoft administrator can map fields and configure parameters while creating the pivot grid base template. A simplified analytic is always mapped with a pivot grid base template. See Configuring Related Content, Related Actions, and Menu and Frame Layouts.
You will not see a runtime prompt while editing or creating an analytic, but you can find it when you open the analytic.
Image: Runtime Prompts on an Analytic
From Date, and To Date were selected under Choose Editable Fields section. The fields are editable.
Note: The values provided for runtime prompts are only used for the current session. They are not retained for further sessions. The analytics opens with default values assigned to the base template.
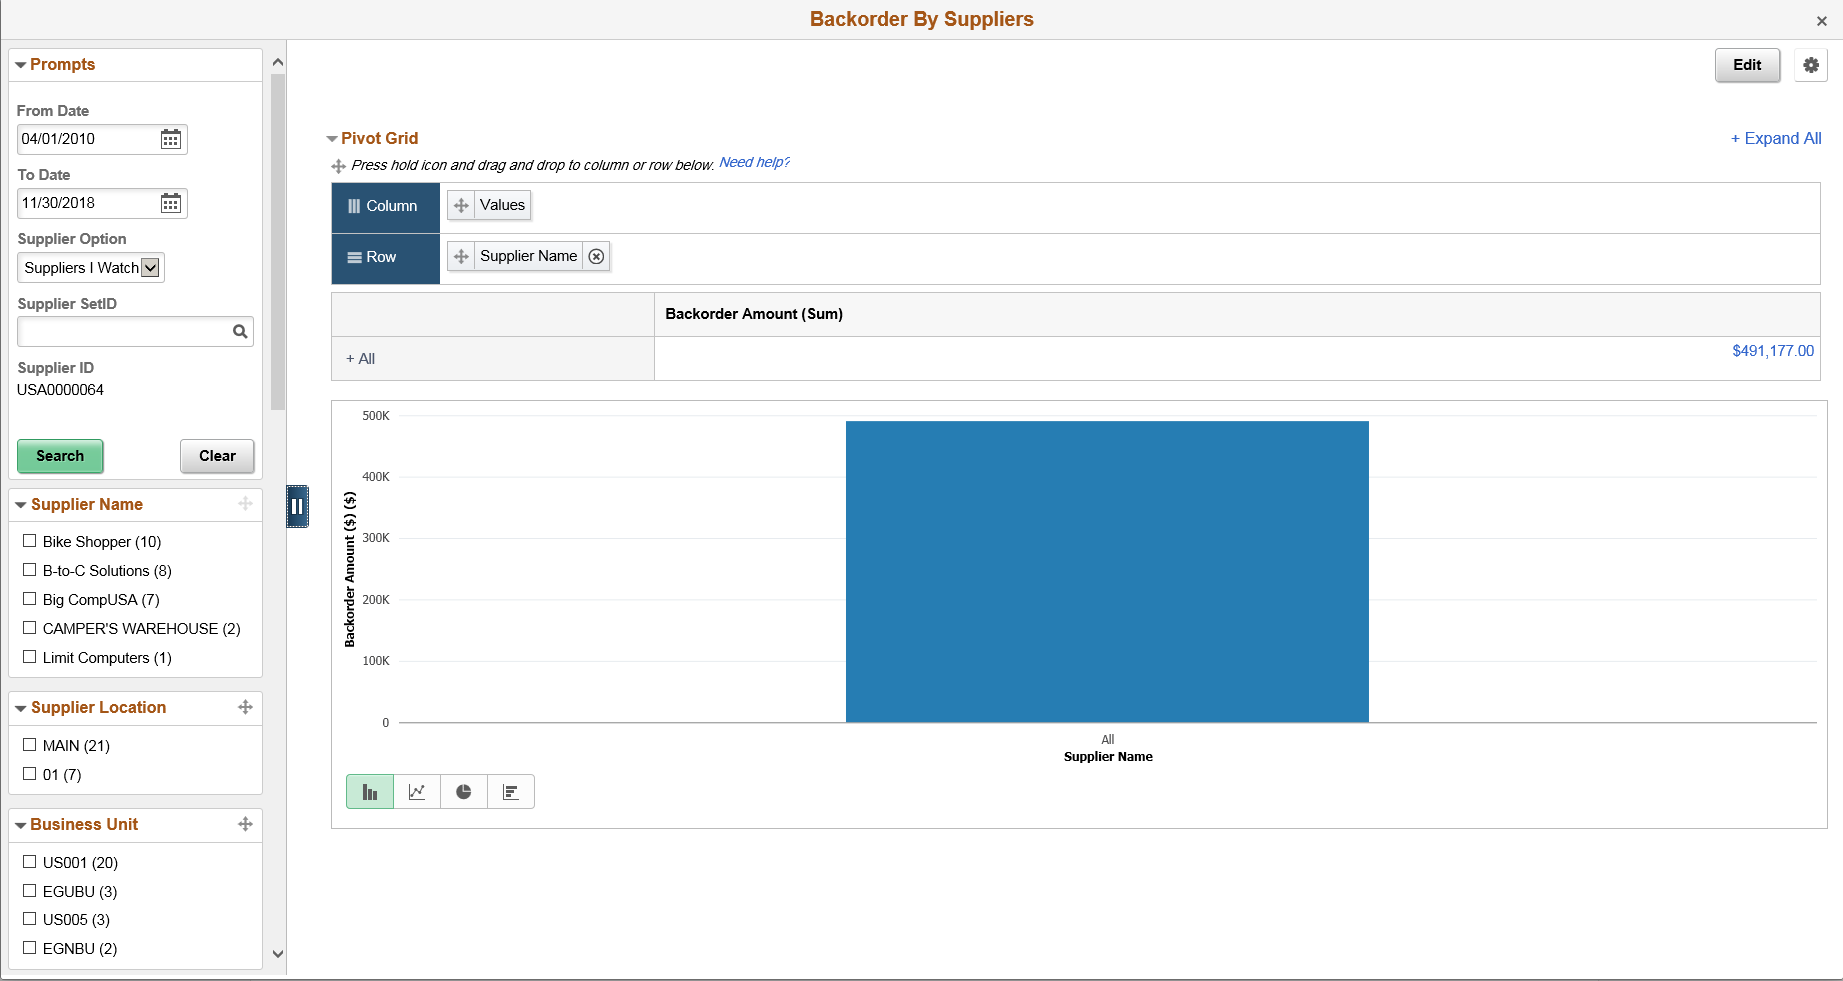
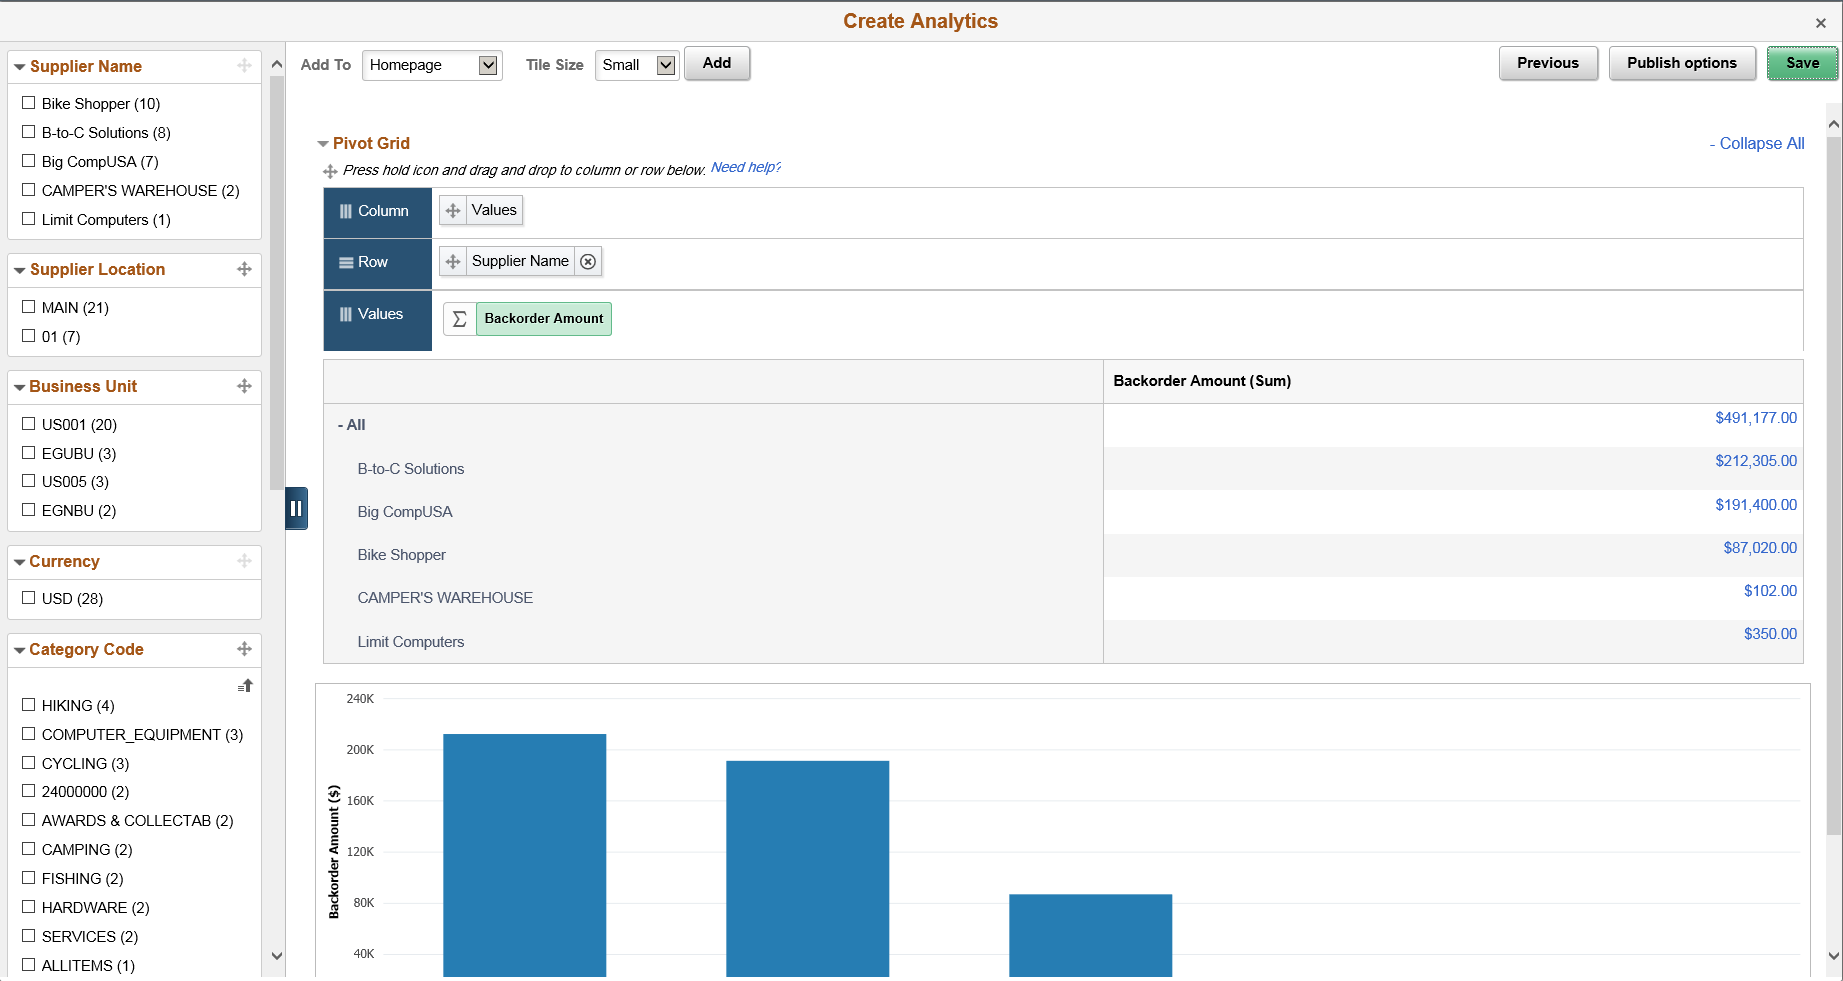
Use the Create Analytics Wizard - step 3 (PTPG_REPORT_WIZ_3) to preview the analytic reports based on the display options, fields, and prompts selected in the previous steps of the wizard. Optionally, you can modify (by dragging and dropping, applying filters, and so on) the analytic to finalize the design and then click the Save button to save the final report.
After you save the analytic you will see the Add To dropdown options.
Image: Create Analytics Wizard - step 3
This example illustrates the preview window of the analytic report, Create Analytics Wizard - step 3.
|
Field or Control |
Definition |
|---|---|
| Facets |
View, select, drag and drop facets to dimensions, and find the required view which you will like to publish and share with other users. |
| Add To |
Select from the dropdown to add to:
|
| Tile Size |
Select from tile sizes:
The sizes are available only when you add to homepage or dashboard. For the NavBar the option is disabled. |
From the preview window, you can:
Change the X-axis, Series, and Y-axis by dragging and dropping these dimensions from the facet area to the row or column section.
Change the chart type by using the chart type short cut icons.
Change the aggregate functions in the Columns area using the Aggregate dropdown list.
Apply facet values.
Use the Save button to save the analytic reports, which are listed under the My Analytics section of the component.
If you are an administrator or super user, saving the analytic enables the Publish Options button, which you can use to publish the analytic reports to the My Analytics section or the Tile repository of all users of the component.
If you are not an administrator or super user, saving the analytic report enables the Add to Homepage button, which you can use to add the analytic report to the fluid homepage.
Note: The Create Analytics Wizard - step 3 does not display the editable facets. If you select a field that is used as an editable facet, that facet is displayed only when you view the analytic report.