Accessing Simplified Analytics
You can access simplified analytics report from the following regions in the PeopleSoft Internet Architecture.
Unified Related Content Analytic Pane
Fluid Homepage
NavBar
Fluid Dashboard
The PeopleSoft administrator has to enable the simplified analytic on an application page.
See Simplified Analytics Overview.
Note: If you access a component with analytics and related information enabled as a master-detail or activity guide target, make sure that the No System Side page option in the component property of the master-detail component or the activity guide step component is selected. If the No System Side page option is not selected, the side page with analytics and related information will not appear when you access the component as part of a master detail target or activity guide step.
You can find the pane on the right side of an application page. When both component-level related information and Simplified Analytics are configured for the component, the right panel of the window shows the related information and analytics. Add Analytics button is displayed only if any analytics configuration exist for the component.
Image: Unified Related Content Analytics Pane
The example below shows the Unified Related Content Analytics pane on the right of the page.
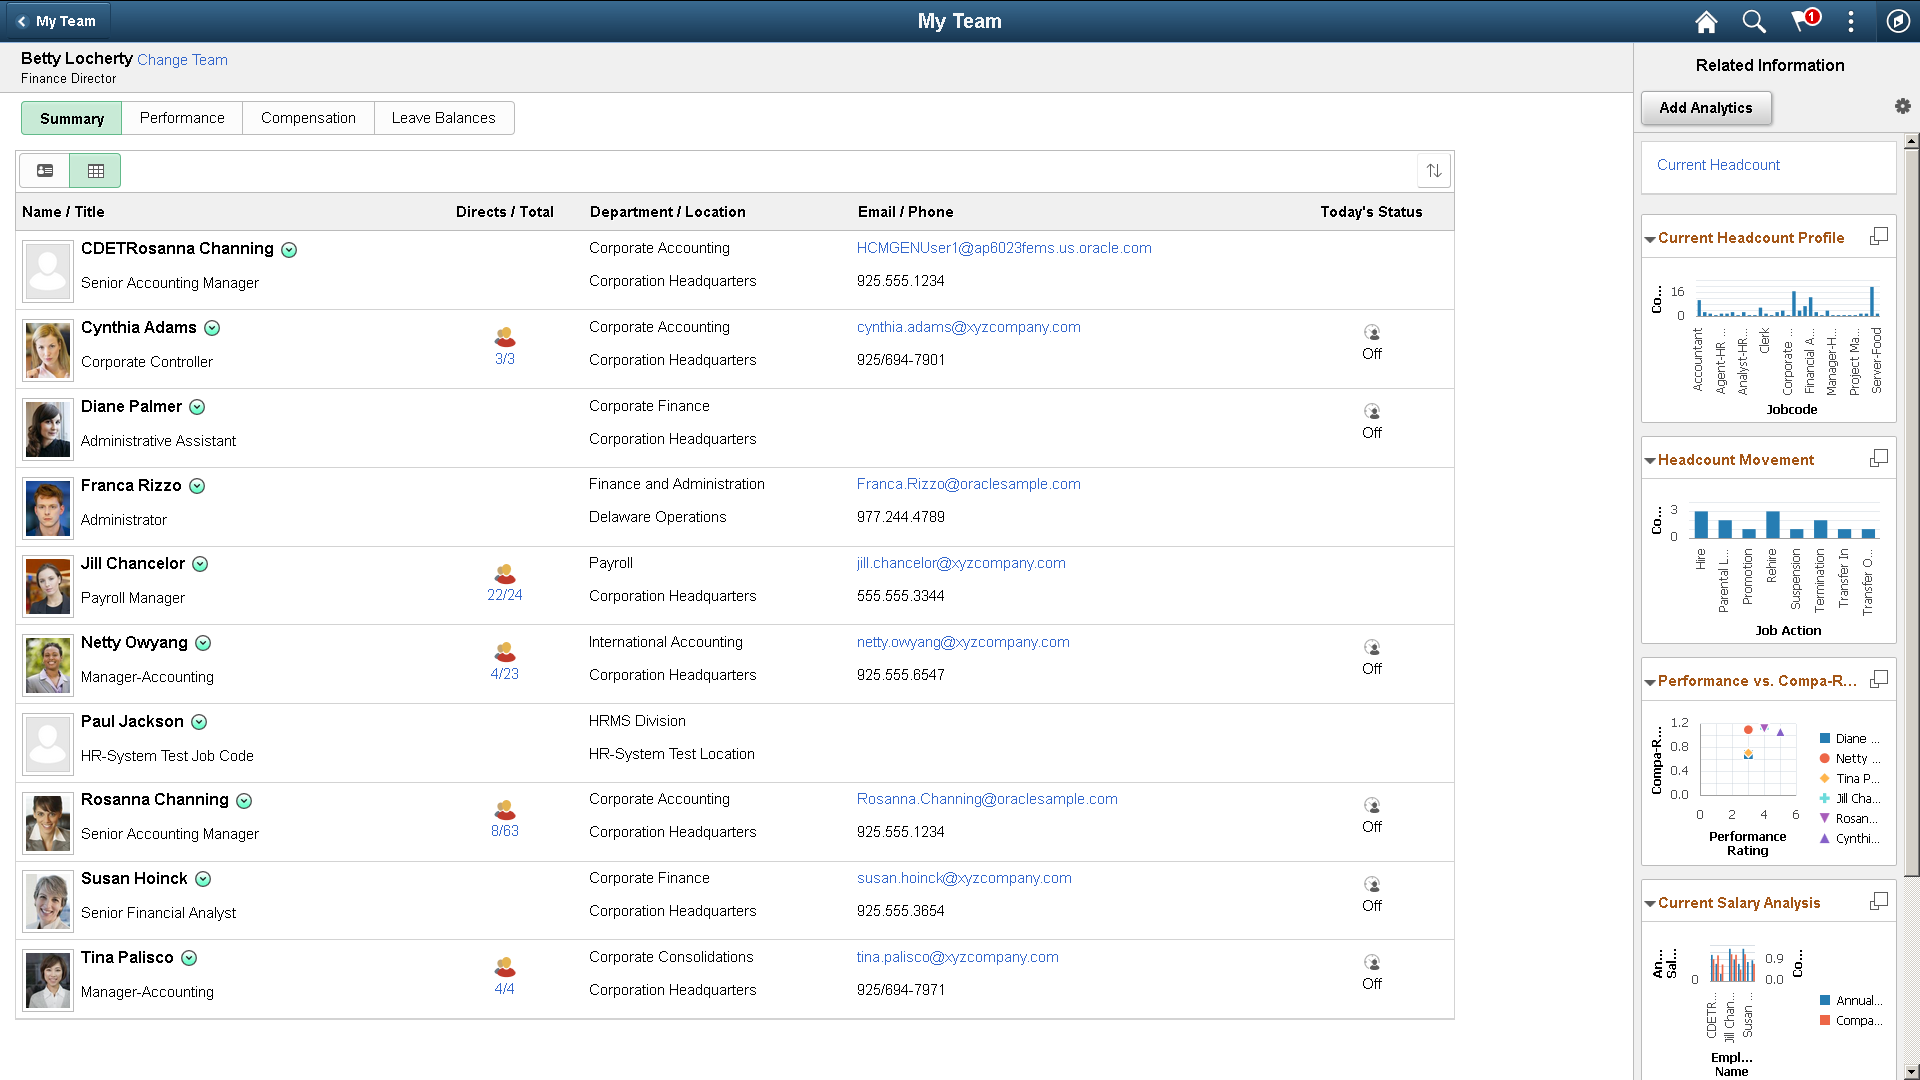
Related Information show as tiles. See Understanding the PeopleSoft Related Content Framework.
Simplified Analytics show as links by default. You can configure the analytics to show as tiles too from the Personalize Related Information button. See Personalizing Unified Related Content Analytics Pane.
You can click the link or the Display analytic in Modal Window button on the top right corner of the tile to open the analytic in modal window.
You can edit the analytic or use other options to configure the analytics from the modal window.
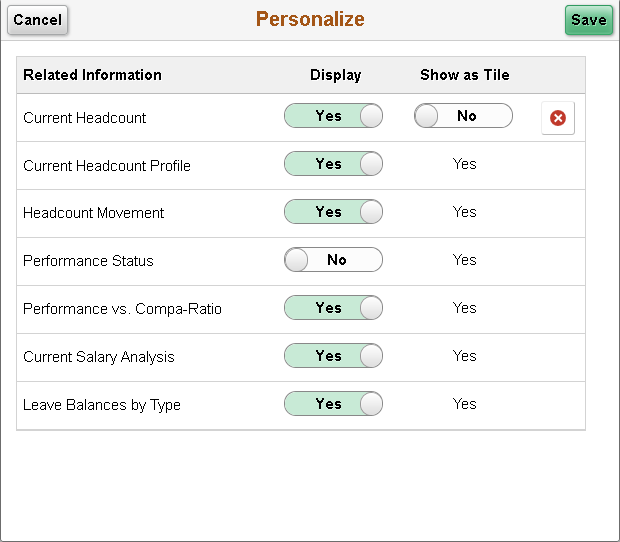
The Personalize Related Information button gives you option to choose to see related information and analytics which you need. It also allows you to delete an analytic as well as display the analytics as a tile or a link.
Image: Personalize Unified Related Content Analytics pane
The example displays the Personalize dialog box. The fields and controls are listed further.
|
Field or Control |
Definition |
|---|---|
| Related Information |
Displays the analytics and related information in the column. |
| Display |
Slide between yes and no to display available analytics and related information. |
| Show as Tile |
Slide to show simplified analytics as a tile. By default all analytics are shown as link on the Unified related Content Analytics pane. |
 |
Delete analytics. Note: Delete button will not show for the analytics, for which user don’t have delete permissions. |
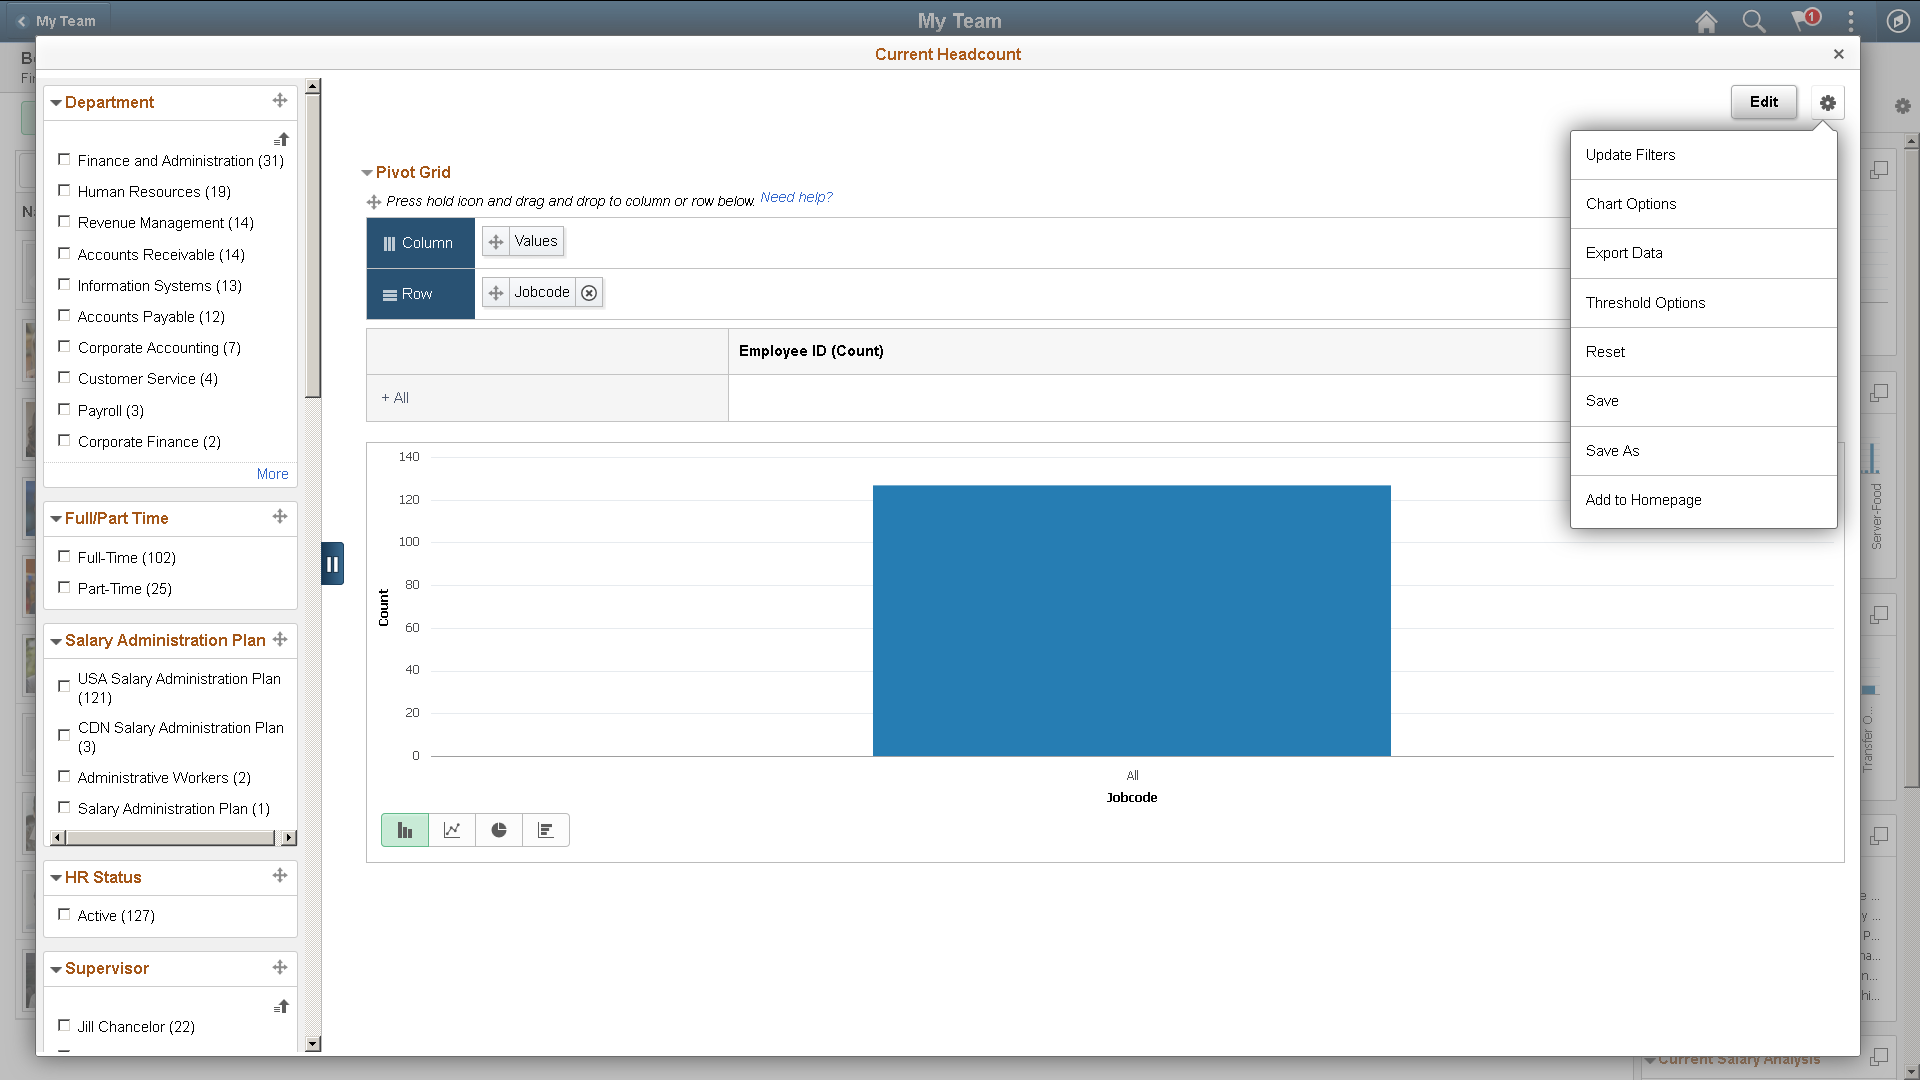
You can add a simplified analytic to the fluid homepage using the Add to Homepage option in Options Menu. By default the analytics appear in a 2x2 tile with the chart preview.
Image: Add to Homepage and other options in Options Menu
This example illustrates the Add to Homepage link and other options in the Options Menu.
Pivot grid administrator can also add the analytic to homepage from the Create Analytics Wizard - step 3 or the Edit Analytics Wizard - step 3.
The system prompts you to select a homepage to add the analytics. It also gives you an option to change the name of the analytics.
Image: Add to Homepage dialog box
From the dialog box you can take following actions:
Select to add the analytics from available homepage.
Create new homepage if required.
Change name of the analytics which will show as the tile label.
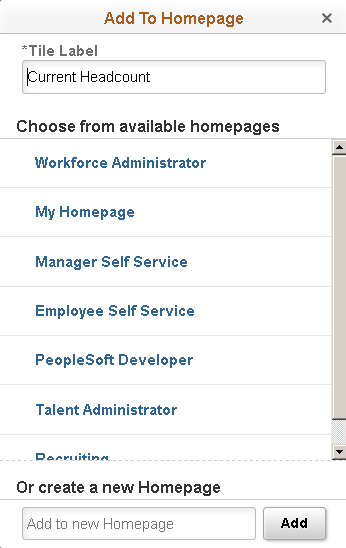
Note: You can add a report once to any homepage. If the report was already added to the homepage and you attempt to add the report again, then you have the option to delete the report from the homepage and add it back to the homepage.
Select NavBar from the Add To dropdown on the Analytics wizard. When you select NavBar the Tile Size dropdown becomes disabled.
The system prompts you to enter a name for the analytic in the Tile Label field, Add to NavBar dialog box.
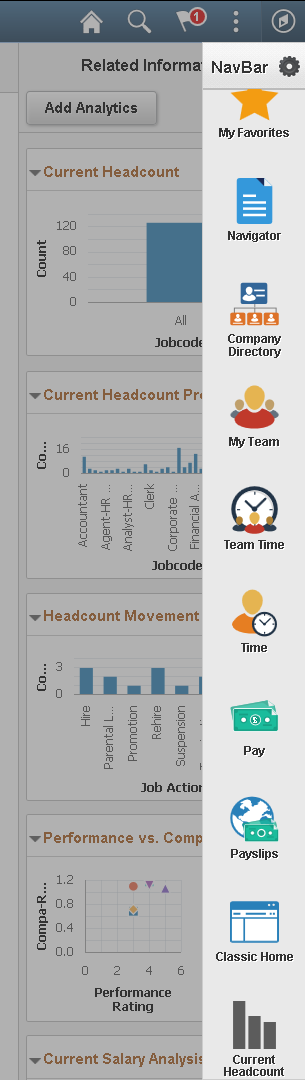
Image: Analytics on the NavBar
The Current Headcount analytic is on the NavBar.
You can even access the analytics from a fluid dashboard.
Select Fluid Dashboard from the Add To dropdown on the Analytics wizard. You will also need to select the size of the tile from the Tile Size dropdown.
You can select the tile size to display the analytics on a homepage or a fluid dashboard. The option Tile Size is available on the Analytics Wizard Step 3.
Below are examples of analytics in available tile sizes.
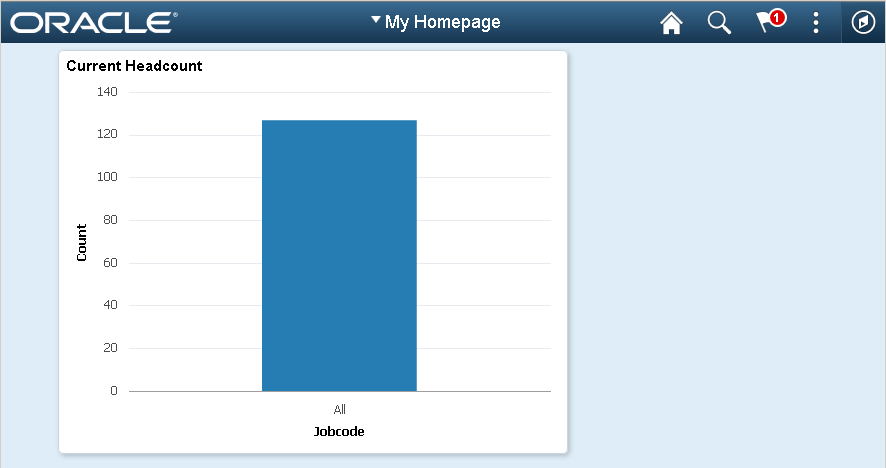
Image: Small Tile Size
The example shows an analytic displayed on a homepage in small size.
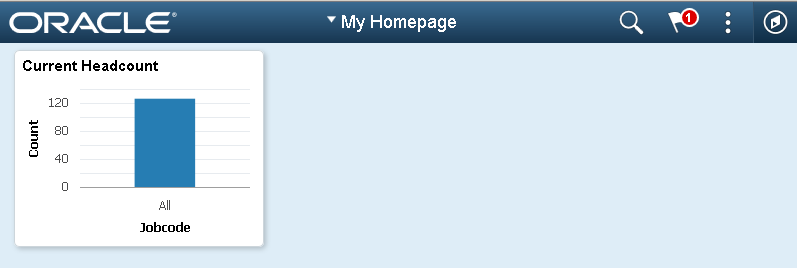
Image: Medium Tile Size
The example shows an analytic displayed on a homepage in medium size.
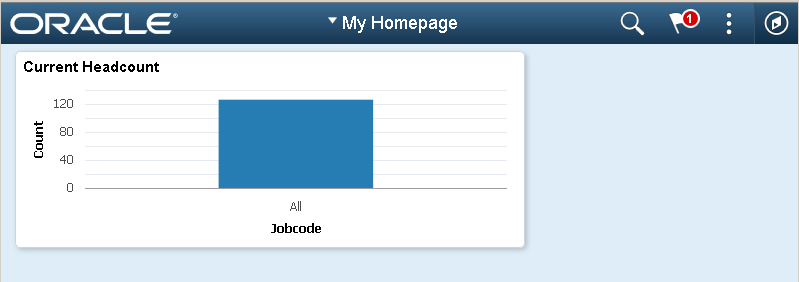
Image: Large Tile Size
The example shows an analytic displayed on a homepage in large size.