Using the Grammar Panel to Add Data to the Visualization
After you’ve selected the datasets for your project, you can begin to add data elements such as measures and attributes to visualizations.
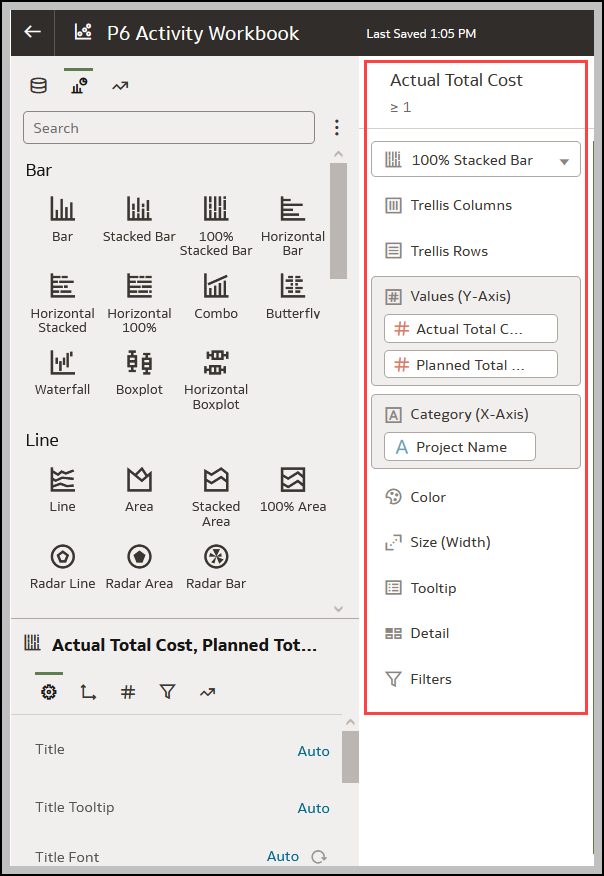
You can select compatible data elements from the datasets and drop them onto the Grammar Panel (shown below) in the Visualize canvas. Based on your selections, visualizations are created on the canvas. The Grammar Panel contains sections such as Columns, Rows, Values, and Category.
- On the Home page, select a workbook, click the Actions menu, and then select Open.
- If you created a workbook, then add a dataset to it.
- Select the Visualize canvas.
- Use one of the following methods to add data elements to the Grammar Panel:
You can only drop data elements based on attribute and type onto a specific Grammar Panel section.
- Drag and drop one or more data elements from the Data Panel to the Grammar Panel in the Visualize canvas.
The data elements are automatically positioned, and if necessary the visualization changes to optimize its layout.
- Replace a data element by dragging it from the Data Panel and dropping it over an existing data element.
- Swap data elements by dragging a data element already inside the Visualize canvas and dropping it over another data element.
- Reorder data elements in the Grammar Panel section (for example, Columns, Rows, Values) to optimize the visualization, if you’ve multiple data elements in the Grammar Panel section.
- Remove a data element by selecting a data element in the Grammar Panel, and click X.
- Drag and drop one or more data elements from the Data Panel to the Grammar Panel in the Visualize canvas.
Related Topics
Last Published Friday, December 8, 2023