Creating Filters on a Visualization
You can add filters to limit the data that’s displayed in a specific visualization on the canvas.
If a workbook contains multiple datasets and some aren't joined, then there are restrictions for how you can use filters. Any visualization that doesn't use the data element of the filter is grayed out.
Visualization filters can be automatically created by selecting Drill on the visualization’s Menu when the Synchronize Visualizations option is turned off in the Canvas Properties dialog.
Instead of or in addition to adding filters to an individual visualization, you can add filters to the workbook or to an individual canvas. Any filters included on the canvas are applied before the filters that you add to an individual visualization.
- On the Home page, select a workbook, click the Actions Menu, and then select Open.
- Click the Visualize tab.
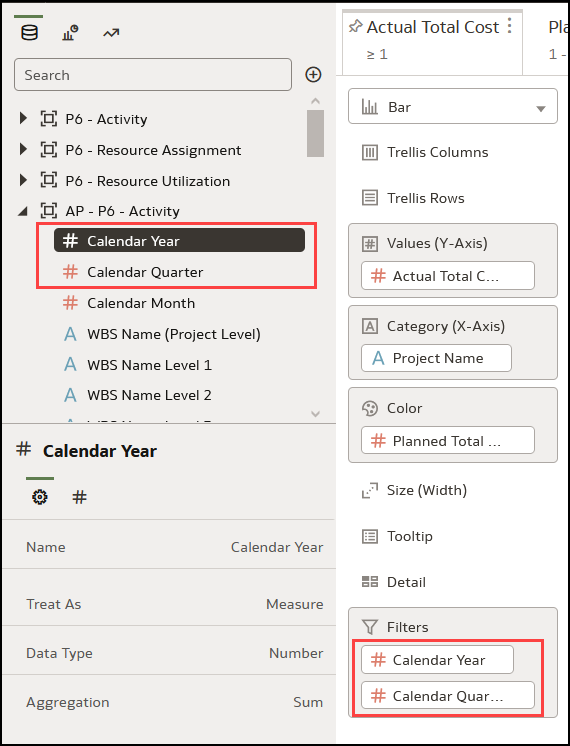
- Select the visualization that you want to add a filter to.
- Drag and drop one or more data element from the Data Panel to the Filter drop target in the Grammar Panel.
To use data elements of a data set as a filter in the visualization of another data set, you have to join both the data set, before using the data elements as filters.
- Set the filter values. How you set the values depends upon the data type that you’re filtering.
- To set filters on columns such as Cost or Quantity Ordered, see Applying Range Filters.
- To set filters on columns such as Product Category or Product Name, see Applying List Filters.
- To set filters on columns such as Ship Date or Order Date, see Applying Date Range Filters.
- Optional: Click the filter bar menu or right-click and click Auto-Apply Filters, then select Off to turn off automatic apply for all filters on the canvas and within the visualization. When you turn off automatic apply, then each filter’s selection displays an Apply button that you must click to apply the filter to the visualization.
- Optional: Click Visualization Filter Bar in the Filter tab of the Grammar Panel to show or hide the visualization filter.
Related Topics
Last Published Friday, December 8, 2023