Using a Visualization as a Filter
You can configure a visualization to filter other visualizations on the canvas.
If a workbook contains multiple datasets and some aren't joined, then there are restrictions for how you can use filters. To use data elements of a dataset as a filter in the visualization of another dataset, you must join both the datasets, before using the data elements as filters. Any visualization that doesn't use the data element of the filter is dimmed.
- On the Home page, select a workbook, click the Actions Menu, and then select Open.
- Click the Visualize tab.
- Select a visualization to use as a filter.
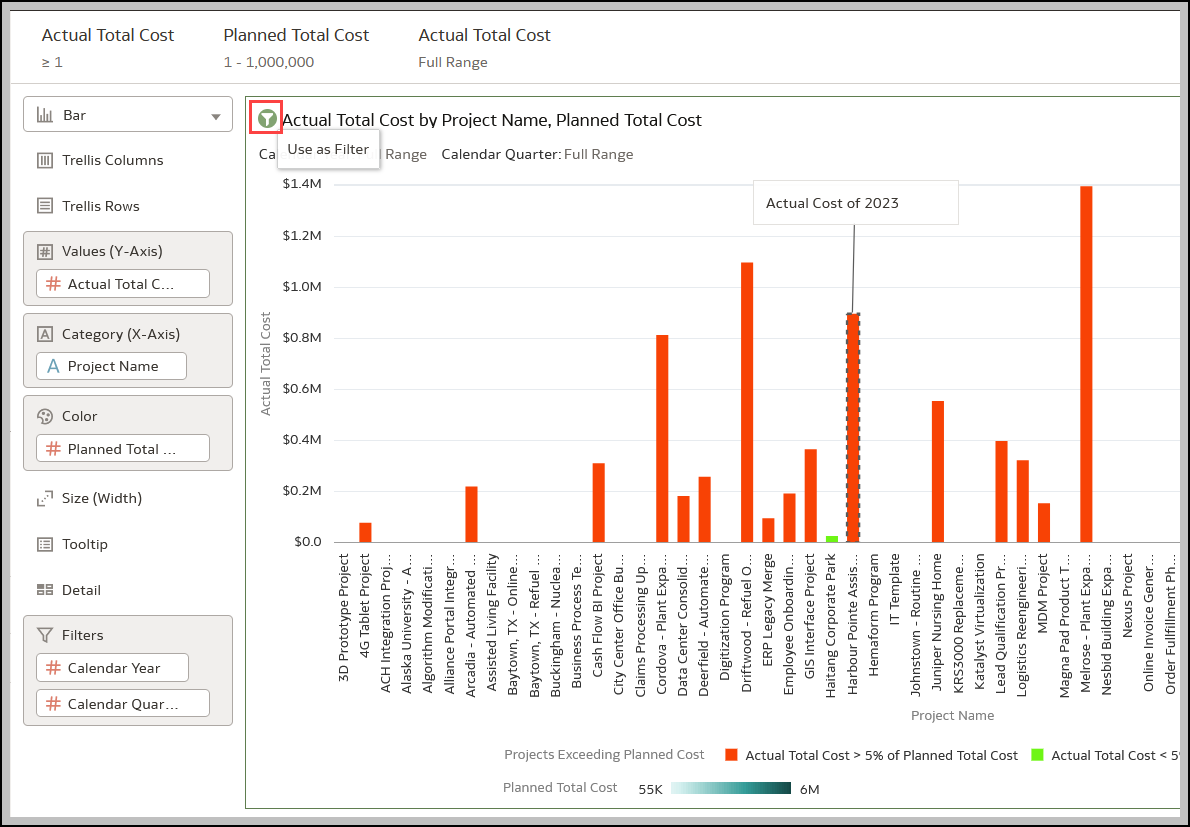
- Click the Use as Filter icon to activate.
Related Topics
Last Published Friday, December 8, 2023