4.2.3 Spatial Studio GeoRasterデータセットのイメージ・タイルとしての表示
Spatial Studioのジオメトリ・データセットをスタンドアロンのMapLibreマップに表示する方法と同様に、Spatial StudioのGeoRasterデータセットもMapLibreマップに簡単に追加できます。これまでの各項で説明したように、GeoRasterデータセットのイメージ・タイルを返すためのRESTエンドポイントには、RESTエンドポイントURLの一部としてイメージ列のidが必要です。データセットのidをプロパティ・ダイアログから簡単に見つけるのとは異なり、この場合は、cURLコマンドを使用してイメージ列idを取得する必要があります。たとえば:
curl -k "https://localhost:4040/spatialstudio/oauth/v1/datasets/<DATASET_ID>/columns?datasetFields=georasterColumns&columnFields=id,name" \
--header "Authorization: Bearer <MY_TOKEN>” 前述のRESTエンドポイントは、指定されたデータセット内のすべての列のメタデータを返します。問合せパラメータdatasetFieldsおよびcolumnFieldsは、指定された名前に一致するフィールドのみがクライアントに返されるようにレスポンスをフィルタするために使用します。この場合、データセットのGeoRasterイメージ列(ラスター・イメージ・データを格納する)の名前を示すgeorasterColumnsフィールドを取得する必要があります。そのデータセット内の個々の列には、nameおよびidのみが必要です。
リクエストは次のようなレスポンスを返します:
{
  "georasterColumns": [
    "IMAGE"
  ],
  "columnDetails": [
    {
      "id": "09b60f1da4c6808d753c57393c6f899f",
      "name": "IMAGE_ID"
    },
    {
      "id": "7223184218fc39ac149c91155a9f9242",
      "name": "MIN_X_RES$"
    },
    {
      "id": "e56426442075b028018175740b64449d",
      "name": "IMAGE"
    },
    {
      "id": "c254f40e6ea6f14f4899c8801b485b24",
      "name": "MAX_X_RES$"
    },
    {
      "id": "5c4d7c6963f7234adc97fafc52c0c04c",
      "name": "DESCRIPTION"
    }
  ]
}前述のレスポンスでは、イメージ列のidはe56426442075b028018175740b64449dで、次のサンプル・コードで、スタンドアロンのMapLibreアプリケーションでSpatial StudioのGeoRasterデータセットを表示するために使用します。
<!DOCTYPE html>
<html lang="en">
<head>
    <meta charset="utf-8">
    <title>Display GeoRaster imagery from Spatial Studio</title>
    <meta name="viewport" content="initial-scale=1,maximum-scale=1,user-scalable=no">
    <script src="https://unpkg.com/maplibre-gl@2.1.9/dist/maplibre-gl.js"></script>
    <link href="https://unpkg.com/maplibre-gl@2.1.9/dist/maplibre-gl.css" rel="stylesheet">
    <style>
        body { margin: 0; padding: 0; }

        .container {
            position: absolute;
            width: 100%;
            height: 100%;
        }
        .control {
            background-color: #a9cce3 ;
            width: 100%;
            height: 100px;
            margin: 5px auto;
        }
        .map_container {
            position: absolute;
            top: 100px;
            bottom: 0;
            width: 100%;
            margin: 5px auto;
        }
    </style>
</head>
<body>

<div class="container">
    <div class="control">
        <form>
          <fieldset>
                <legend>GeoRaster display settings</legend>
                <p>
                    <input type="checkbox" name="nodata_flag" id="nodata_flag">
                    <label for="nodata_flag">Show NODATA values as transparent</label>
                </p>
          </fieldset>
        </form>
    </div>

    <div class="map_container" id="map"></div>
</div>


<script>
    // basic information about the remote Spatial Studio instance that is serving the GeoRaster images.
    const spatialStudio = {
        // the base URL for accessing Spatial Studio dataset's GeoRaster image tiles using an access token
        baseUrl : 'https://localhost:4040/spatialstudio/oauth/v1',
        rasterTileEndpoint: '/rt/e56426442075b028018175740b64449d/{z}/{x}/{y}.png',
        // a stream-only access token issued by Spatial Studio
        accessToken: 'eyJ0eXAiOiJzZ3R...qOdHV3koQsYF_MkKQ'
    };

    const sourceId = 'spatial-studio-raster-tiles1';

    const map = new maplibregl.Map({
        container: 'map',
        // Gets the OpenStreetMap basemap from maptiler.com. You must change to use your own maptiler API key and agree to their terms of usage.
        style: 'https://api.maptiler.com/maps/openstreetmap/style.json?key=YOUR_KEY,
        zoom: 6,
        center: [-90.241936, 33.911399],

        //This option sets a Spatial Studio access token when requesting the image tiles of a GeoRaster dataset.
        transformRequest: (url, resourceType) => {
            if (resourceType === 'Tile'&& url.startsWith(spatialStudio.baseUrl)){
                return {
                    url: url,
                    headers: {'Authorization': 'Bearer ' + spatialStudio.accessToken}
                }
            }
        }
    });

    // Controls the visual appearances of the GeoRaster images generated by Studio. This is appended to the Studio tile request URLs.
    let geoRasterVisualProperties = {"reprojection":{"mode":"NN","medianfilter":false},"transpnodata":false,"virtualmosaic":{"resolfilter":true,"nodata":true,"fillgap":true,"commonpointrule":"HIGH"},"bands":{"red":1,"green":2,"blue":3,"alpha":-1}};

    map.on('load', function () {
        // Adds the image tiles for the Spatial Studio GeoRaster dataset with the specified column id (not dataset id) "e56426442075b028018175740b64449d" to
        // the map.
        //
        map.addSource(sourceId, {
            'type': 'raster',
            'tiles' : [
                   spatialStudio.baseUrl + spatialStudio.rasterTileEndpoint + '?visualProperties=' + JSON.stringify(geoRasterVisualProperties)
                ],
            'minzoom': 5,
            'maxzoom': 20,
            'tileSize' : 256,
            // this tells MapLibre API that the dataset only has GeoRaster images within this bounding box
            'bounds': [-90.4895407500805, 32.3190270753724, -89.9586424931126, 35.2761555998833]
        });

        // Defines and adds a layer from the above Map source.
        map.addLayer(
            {
                'id': 'my_georaser_layer',
                'type': 'raster',
                'source': sourceId,
                'paint':  {
                    'raster-opacity': 0.72,
                    'raster-hue-rotate': 0,
                    'raster-brightness-min': 0,
                    'raster-brightness-max': 1,
                    'raster-saturation': 0,
                    'raster-contrast': 0,
                    'raster-fade-duration': 300
                }
            }
        );
    });

    map.addControl(new maplibregl.NavigationControl());

    // Toggles the display of GeoRaster NODATA values between transparent or not.
    // This is done by changing the visual properties object's "nodata" field,
    // then reloading the GeoRaster images from Spatial Studio using the new properties.
    function toggleNODATA(flag) {
        if (geoRasterVisualProperties.transpnodata === flag) {
            return; // do nothing since we are already using the input value
        }

        geoRasterVisualProperties.transpnodata = flag;

        // update map source so that future tile requests will generate tiles with the new visual properties.
        const sourceObj = map.getSource(sourceId);
        const newTileUrl = spatialStudio.baseUrl + spatialStudio.rasterTileEndpoint + '?visualProperties=' + JSON.stringify(geoRasterVisualProperties);

        sourceObj.tiles = [newTileUrl];
        // Remove all the existing, cached tiles of the GeoRaster source
        map.style.sourceCaches[sourceId].clearTiles();
        // Reloads the GeoRaster image tiles for the current viewport (map.transform -> viewport)
        map.style.sourceCaches[sourceId].update(map.transform);
        // Force a map repaint
        map.triggerRepaint();
    }

    // add callback to the nodata checkbox
    const nodataCheckbox = document.querySelector('#nodata_flag');

    nodataCheckbox.addEventListener('change', () => {
        if(nodataCheckbox.checked){
            toggleNODATA(true);
        } else {
            toggleNODATA(false);
        }
    });

</script>

</body>
</html>
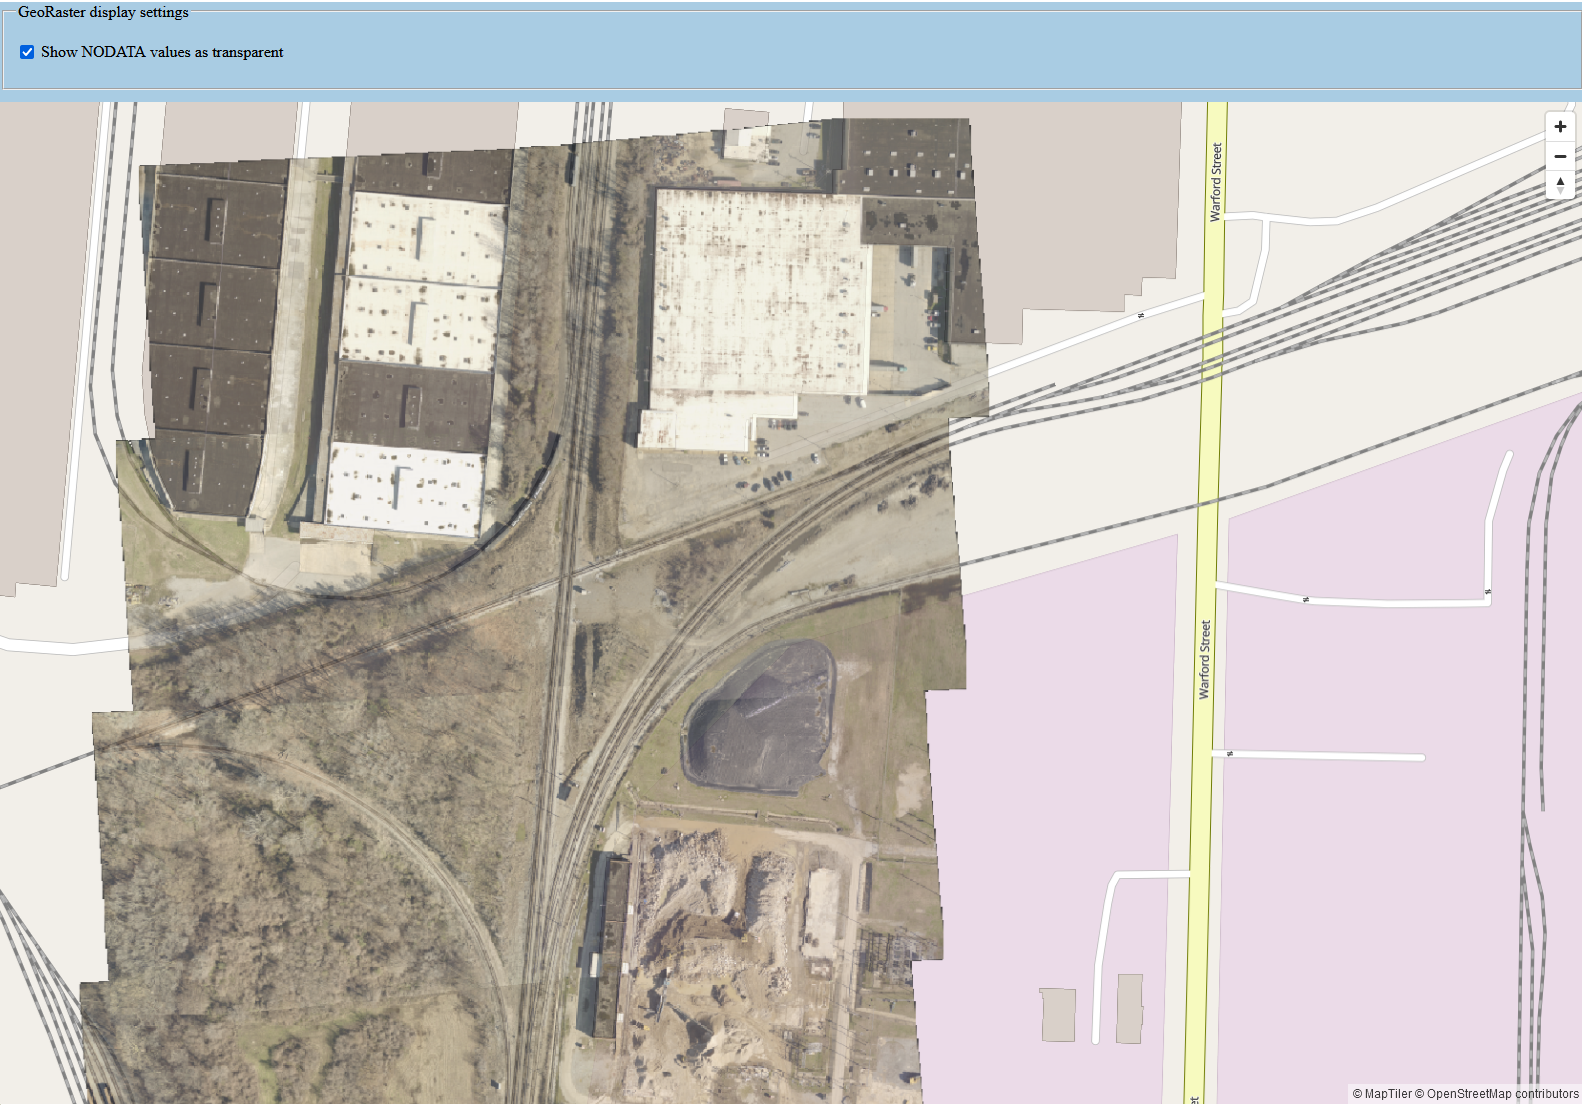
OpenStreetMapの上にGeoRaster (高解像度イメージ)がオーバーレイされた出力マップを次に示します。「NODATA値を透明として表示」を切り替えると、GeoRasterイメージにNODATA領域が黒または透明のピクセルとして表示されます。
前述のGeoRasterイメージでは次の点に注意してください:
- 全体的なパターンは引き続き、ジオメトリ・データセットの表示方法に似ています。変更が必要なのは、Spatial StudioのRESTエンドポイントと、MapLibreソース・オブジェクトおよびレイヤー・オブジェクトの定義方法のみです。
- イメージ・タイル・リクエストの一部としてビジュアル・プロパティ・ペイロードを指定することで、生成されたイメージ・タイルを微調整できます。
- Spatial Studioは、ブラウザのイメージ・タイル・リクエストに基づいたGeoRaster表または仮想モザイクへの問合せ、指定したビジュアル・プロパティの適用、結果イメージのブラウザへの返送など、すべてのバックエンド・プロセスを処理します。
