Timeline Components
This topic provides information about timeline components, which can be used in data visualization dashboards. This topic is part of About Data Visualization Components.
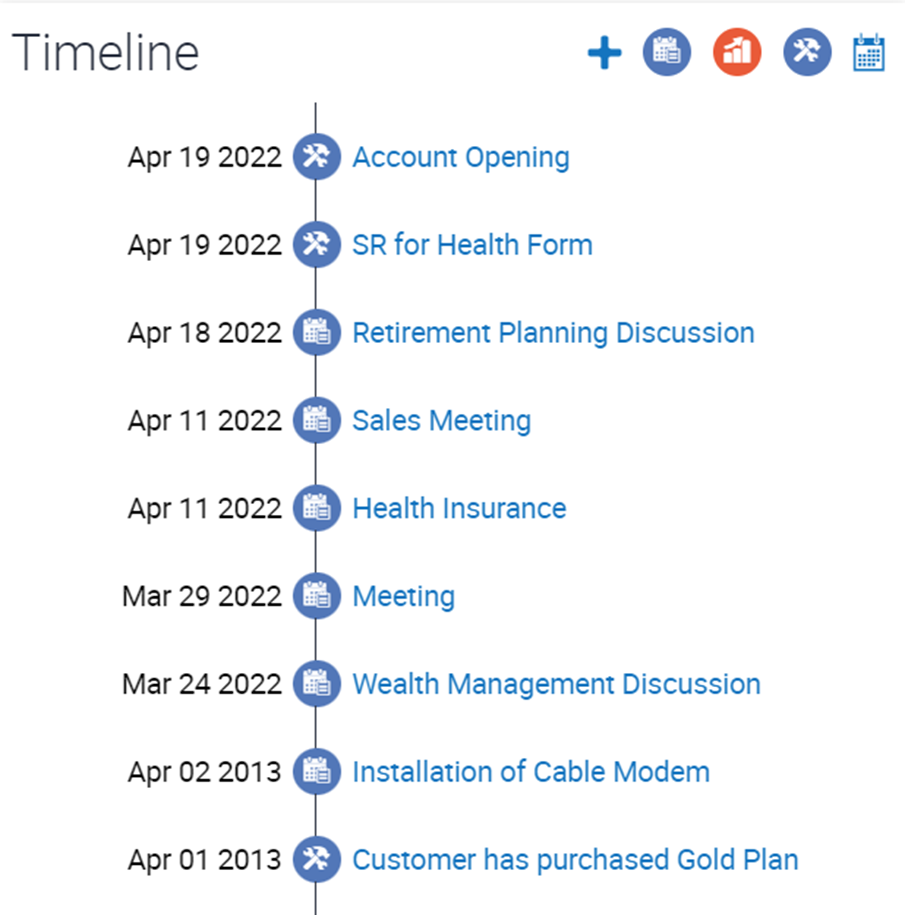
The timeline applet can display various entities (like activities, opportunities, sales orders, and service requests) for a business object, such as Account or Contact. The entities are displayed in reverse chronological order, with the most recent record at the top. Each type of entity is displayed using a different icon. Icons are configurable.

Note the following:
-
Clicking the calendar icon allows users to filter the data based on a date range. Users can also filter the data based on the type of entity. The entity filter buttons are toggle buttons. Clicking a button hides entity data from the timeline and the button dims. Clicking the dimmed button displays that entity on the timeline again.
-
Clicking the plus button (+) allows the user to enter a new activity. Clicking the + icon in the timeline brings up the Add Activity pop-up applet. Once the activity is added, it appears in the timeline.
-
Clicking the description for a timeline item allows the user to drill down and navigate to the Detail view. For example, clicking an opportunity item navigates to the Opportunity Details view, while clicking a sales order navigates to the Sales Order Details view.
For configuration information, see Configuring Timeline Components.