Working with Services Operational Dashboards
This topic discusses how to work with Services Operational Dashboards.
|
Page Name |
Definition Name |
Usage |
|---|---|---|
|
Services Manager Dashboard Page HelpDesk Manager Dashboard Page HR HelpDesk Manager Dashboard Page Service Center Mgr Dashboard Page |
(not applicable) |
Access the Manager Dashboard to view information and take actions regarding cases that are assigned to provider groups of the manager selected in the logged on user's personalization settings. |
|
Services Agent Dashboard Page HelpDesk Agent Dashboard Page HR HelpDesk Agent Dashboard Page Service Center Agent Dashboard Page |
(not applicable) |
Access the Agent Dashboard to view information and take actions regarding cases that are owned by agents. |
|
Field or Control |
Definition |
|---|---|
 (Refresh) (Refresh) |
Click to refresh data display on the corresponding pagelet. Or, press the F5 key or the refresh button of the web browser to refresh all pagelets in the entire dashboard. Note: Refresh the dashboards for the latest operational data to be displayed. |
 (Personalize) (Personalize) |
Click to personalize settings of the corresponding pagelet. The same options are also available on the User Preferences - Call Center page. When you make changes here, the changes are reflected in the pagelet display as well as the User Preferences component. The system delivers these pages to personalize individual dashboard pagelets: Important! Oracle highly recommends that you specify your personalization options and values for all pagelets so they can display information that pertains to your job area.
See Call Center Page. |
 (Minimize) and (Minimize) and  (Expand) (Expand) |
Click to toggle between collapsing and expanding the corresponding pagelet. |
 (Remove) (Remove) |
Click to remove the corresponding pagelet from the dashboard. Use the Content link on the PIA home page to add back deleted pagelets. |
| View By |
Select how the case information should be filtered and displayed on pagelets with bar charts, by status, priority, or predefined time frame. |
| ID |
Click the solution ID link to view the solution detail in a modal secondary page. |
Access the Services Manager Dashboard page (Services Manager Dashboard).
Cases at Risk of Exceeding SLA Pagelet (RC_SLAEXCEED_PLT)
This pagelet displays the number of cases, which are assigned to provider groups of the manager selected in the logged on user's personalization settings, that are at risk of missing or already missing their SLAs. In the CRM system, a case is considered at risk of exceeding its SLA when its yellow date and time is about to pass or have passed, or exceeding its SLA when its red date and time is about to pass or have passed. A yellow or a red date and time refers to the restore time of a case that is running the risk of failing to meet its SLA. The restore time of a case is calculated based on the entitlements of the agreement that the case associates with. The calculation takes into account the service level selected on the agreement and the holiday schedule. When you save a case with an agreement selected, the restore time is computed and populated on the More tab of the Case page. As an administrator, you can configure the system to alert agents and managers of cases that are at risk of not meeting SLAs. Enable the Percent of SLA for Red and Percent of SLA for Yellow options on the Business Unit - Options page and enter the percentages of case restore time that has elapsed for the system to turn an unresolved case to red (exceeds SLA) and yellow (at risk of exceeding SLA) statuses. For example, the restore time of a newly saved case is set to 10 hours from now. If the SLA for red and SLA for yellow are set at 90 and 50 percents of the case restore time, the system turns the unresolved case to the yellow state in five hours and the red state in nine hours. As delivered, the restore dates and times for the red state and yellow state are enabled for display on Support cases.
Managers can use information provided in this pagelet to identify provider groups and agents who are struggling to meet customer SLA commitments. They see how these cases are allocated among provider groups by status and priority. With this data, they can take actions, such as reassigning cases, to balance the workload of each of their provider groups.
Image: Cases at Risk of Exceeding SLA pagelet in Manager Dashboard
This example illustrates the fields and controls on the Cases at Risk of Exceeding SLA pagelet in Manager Dashboard.
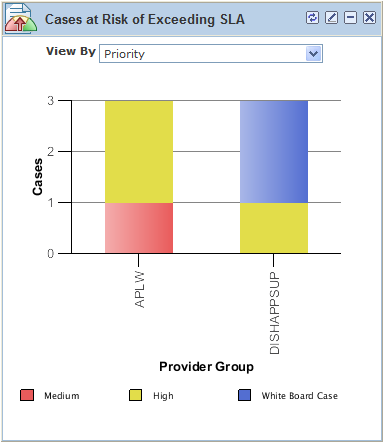
Note: Case priority is not a required field in cases; for cases that do not have this value specified, they are represented in bar chart pagelets using the No Priority legend.
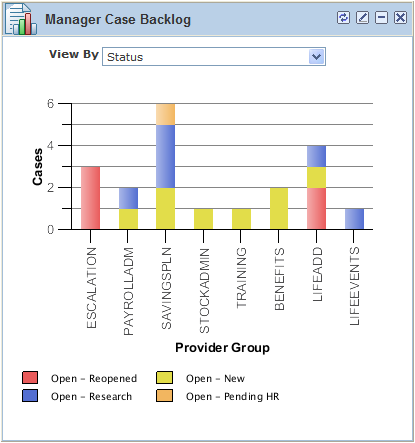
Manager Case Backlog Pagelet (RC_BACKLOG_MGR_PLT)
This pagelet displays the number of open cases that are assigned to provider groups of the logged on manager, by priority or status.
Image: Manager Case Backlog pagelet in Manager Dashboard
This example illustrates the fields and controls on the Manager Case Backlog pagelet in Manager Dashboard.
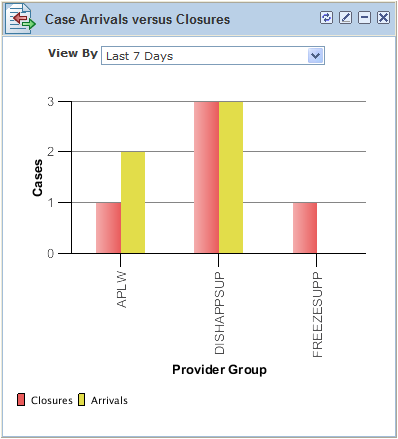
Case Arrivals Versus Closures Pagelet (RC_ARRIVAL_PLT)
This pagelet displays the numbers of new cases and closed cases that are assigned to provider groups of the manager selected in the logged on user's personalization settings. Managers can choose the time range for which the information is presented: for the past day, the past seven days, or the past 30 days. The pagelet provides a side-by-side comparison of the numbers, giving managers an idea of how each provider group is doing in terms of workload and availability.
The data on case arrivals and case closures, as shown on this pagelet, is based on the case created date and case closed date (viewable in the Audit History section of cases).
Image: Case Arrivals versus Closures pagelet in Manager Dashboard
This example illustrates the fields and controls on the Case Arrivals versus Closures pagelet in Manager Dashboard.
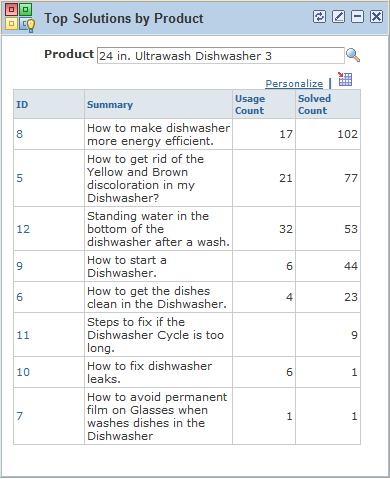
Top Solutions by Product Pagelet (RC_SOLPROD_PLT)
This pagelet lists the top ten most frequently used solutions to resolve cases created for the specified product. Solutions with the highest solved counts appear first, followed by those with the highest usage counts, and the most recently used.
Only active, non-adhoc type solutions are eligible for display on this pagelet.
Solutions are associated with products on the Related Actions page on the Solution component.
Image: Top Solutions by Product pagelet in Manager and Agent Dashboards
This example illustrates the fields and controls on the Top Solutions by Product pagelet in Manager and Agent Dashboards.
Note: As delivered, the Top Solutions by Product pagelet is not displayed on HR HelpDesk dashboard pages as product groups and products are not enabled in display templates for use in HR HelpDesk cases. However, if you have these fields enabled for HRHD cases, you can make this pagelet available on both dashboards to view top solutions that are filtered by products.
|
Field or Control |
Definition |
|---|---|
| Product |
Select the name of the product by which the solution list is filtered. The system populates the default value of this field that is specified on the Call Center page of the User Preferences component. See Call Center Page. |
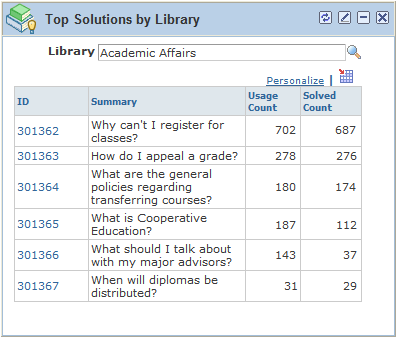
Top Solutions by Library Pagelet (RC_SOLLIB_PLT)
This pagelet lists, for the specified library, the top ten most frequently used solutions to resolve cases. Solutions with the highest solved counts appear first, followed by those with the highest usage counts, and the most recently used.
Only active, non-adhoc type solutions are eligible for display on this pagelet.
Image: Top Solutions by Library pagelet in Manager and Agent Dashboards
This example illustrates the fields and controls on the Top Solutions by Library pagelet in Manager and Agent Dashboards.
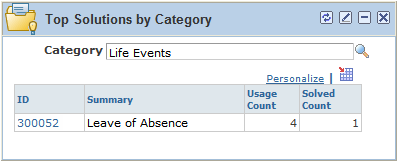
Top Solutions by Category Pagelet (RC_SOLCAT_PLT)
This pagelet lists, for the specified case category, the top ten most frequently used solutions to resolve cases. Solutions with the highest solved counts appear first, followed by those with the highest usage counts, and the most recently used.
Only active, non-adhoc type solutions are eligible for display on this pagelet.
Solutions are associated with case categories on the Related Actions page on the Solution component.
Image: Top Solutions by Category pagelet in Manager and Agent Dashboards
This example illustrates the fields and controls on the Top Solutions by Category pagelet in Manager and Agent Dashboards.
Access the Services Agent Dashboard page (Services Agent Dashboard).
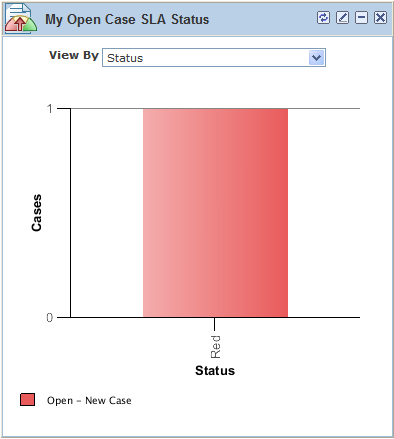
My Open Case SLA Status Pagelet (RC_MYSLA_PLT)
This pagelet displays, for the logged on agent, all of his or her open cases that are at risk of missing or already missing their SLAs. Agents can use information provided in this pagelet to identify cases that need immediate attention. Data on this pagelet can be viewed by case status or priority.
Refer to the Cases at Risk of Exceeding SLA Pagelet section for more information on how the system determines cases that are at risk of exceeding or already exceeding SLAs.
Image: My Open Case SLA Status pagelet in Agent Dashboard
This example illustrates the fields and controls on the My Open Case SLA Status pagelet in Agent Dashboard.
My Case Backlog Pagelet (RC_BACKLOG_AGT_PLT)
This pagelet displays the number of open cases that are assigned to the logged on agent. Data on this pagelet can be viewed by case status or priority.
Image: My Case Backlog pagelet in Agent Dashboard
This example illustrates the fields and controls on the My Case Backlog pagelet in Agent Dashboard.
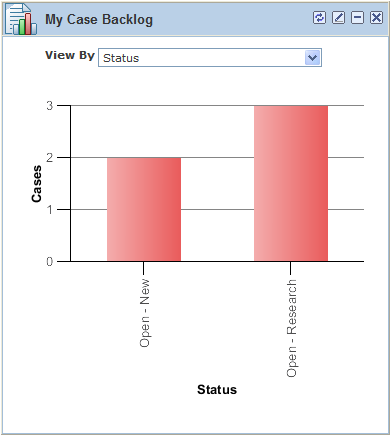
Note: Case priority is not a required field in cases; for cases that do not have this value specified, they are represented in bar chart pagelets using the No Priority legend.
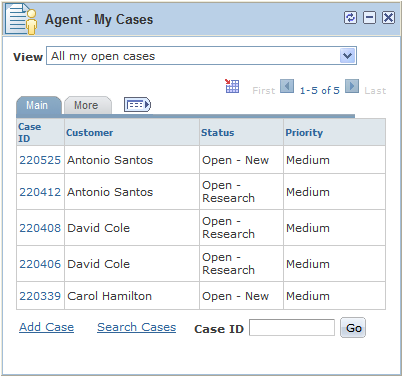
Agent - My Cases Pagelet (RC_AGT_CASES_PGT_W)
Similar to the My Case Backlog pagelet, this pagelet displays open cases that are currently assigned to the logged on agent. In this pagelet, case information is presented in a grid, allowing agents to sort cases by column headings and prioritize their cases based on, for example, customer, case summary, case creation date, priority, status, or entitled restore date and time. Click a case ID link to open and edit the case in a browser window or tab.
Delivered views are available in this pagelet for agents to filter cases that they are interested in:
All of my cases that were modified in the past 30 days.
All of my cases that were modified in the past 7 days.
All of my open cases.
All unassigned cases in my provider group.
Through this view, agents can review and cherry-pick unassigned cases to work on based on their skills and availability.
In addition, agents can add new cases (created using case default values that are specified for agent's business unit) and search existing cases (associated with agent's business unit) from this pagelet.
Image: Agent - My Cases pagelet in Agent Dashboard
This example illustrates the fields and controls on the Agent - My Cases pagelet in Agent Dashboard.
Top Solutions by Product Pagelet
This pagelet lists the top ten solutions that are most frequently used to resolve cases created for the specified product.
See Working with the Manager Dashboard
Top Solutions by Library Pagelet
This pagelet lists, for the specified library, the top ten solutions that are most frequently used to resolve cases.
See Working with the Manager Dashboard
Top Solutions by Category Pagelet
This pagelet lists, for the specified case category, the top ten solutions that are most frequently used to resolve cases.
See Working with the Manager Dashboard