Preparing Data
This chapter covers the following topics:
- Overview of Preparing Data
- Understanding Time Series Feature Sets
- Setting Up Time Series Feature Sets
- Defining Key Performance Indicators
- Creating Datasets for Analysis
- Viewing Sensor Summary Results
Overview of Preparing Data
Before creating data models, you must create datasets for analysis by extracting the features from time series data and from structured data.
Use time series feature sets to define the slicing of time series data into multiple time segments and summarize the data using various functions such as average, standard deviation, min, max, and so on.
Use the dataset you create to prepare features from structured entities of the data lake such as operation duration, resource usage, operator worked, and so on, that are grouped under the Manpower, Machine, Material, Method and Management categories. Datasets also prepare features from the time series data based on the summary functions defined in the time series feature sets.
Use sensor summary results to review the summarized values of the time series features and compare the values across the work orders or serial units. The solution provides configuration of custom specific features using web services, which can be used for the analysis.
Understanding Time Series Feature Sets
Time series data consists of a sequence of values or events obtained over a period of time. It is an ordered data set with data points in specified intervals. Time series data are very high dimensional, noisy and covariant. This makes the data difficult to use for basic statistical operations or other complex data mining tasks. As it is challenging to directly use time series data in machine learning algorithms, time series feature sets definitions provide a flexible and extensible way to define and compute summaries from time series data. These time series features can then be used for model building and analysis.
Time-series feature sets can be used for:
-
Production Analysis Usage - by extracting features from the sensor stream data for model building. On creating a dataset, contextualized stream data from the sensor devices is used to generate the sensor summary data in the duration of actual work order operation.
Note: While the machine can send sensor data when the machine is in faulted or in an idle state, for analysis purposes only the sensor data available during the actual operation execution is used. Any data outside the actual operation execution is not considered for model analysis.
-
Machine Event Analysis Usage- by deriving alerts from the sensor stream data based on threshold violation or SAX pattern match rules. It is used only for event identification and is not used for model analysis.
Time-series feature sets are created from the combination of the specific time segment and the specific simple function or advanced function you choose:
-
Time Segments:
Segmentation is the process of dividing the time series into segments or subsets. Each time segment is treated independently and a specific segment can be chosen/used for model building.
For example, an ERP equipment instance works on a particular work order or batch for a certain duration, then remains idle for the rest of the time. Sensor data from a manufacturing process can be functionally segmented based on the work order information. You can choose the time segment for viewing sensor summary. You can choose the required time segment during model building.
The following are the three options to define time segments:
-
Fixed: Divides time series into segments of fixed duration.
For example, for a work order of 5 hours duration, assuming that each segment is fixed for one hour, the time series data is divided into five segments each of one hour duration.
-
Sliding: Divides time series into segments of the same duration over a sliding interval.
For example, for a work order of 5 hours duration, if you apply a sliding segment of one hour and a sliding interval of 10 minutes, the time series data is divided into segments each of one hour and segmented over 10 minutes interval. In this example, it will generate 25 time segments in minutes from 0 to 60, 10 to 70, 20 to 80 and so on, up to 240 to 300 minutes.
-
Full: Sets a single segment over the entire duration of equipment usage.
For example, for a work order of 5 hours duration, a full segment covers the entire duration of work order operation which is 300 minutes.
Note: Duration and interval unit is in minutes.
-
-
Simple Functions
Time series data in each time segment can be further transformed before computing the summary or events.
For production analysis, the available simple functions are:
-
Average: Average of all data points
-
Standard Deviation: Standard deviation of all data points
-
Minimum: Minimum value of all data points
-
Maximum: Maximum value of all data points
-
Count Above Threshold: Number of data points above the threshold value
-
Count Below Threshold: Number of data points below the threshold value
-
Count Within Range: Number of data points inside a range value specified
-
Count Outside Range: Number of data points outside a range value specified
For machine event analysis, the available simple functions are:
-
Above Threshold Alert: Alert event when a data point goes above the threshold value
-
Below Threshold Alert: Alert event when a data point goes below the threshold value
-
Within Range Alert: Alert event when a data point falls inside a range value specified
-
Outside Range Alert: Alert event when a data point falls outside a range value specified
-
-
Advanced Functions
The time-series feature set definition can make use of Symbolic Aggregate approXimation advanced functions. Symbolic Aggregate approXimation (SAX) is a symbolic representation for complex time series data.
For example, temperature readings from a furnace every millisecond can have 86400000 records in a day. In order to perform any efficient data mining on such massive datasets, the time series data is transformed into another form which retains most of the information in the original raw data. Data mining can then be performed on such approximated transformation. Symbolic Aggregate approXimation creates an approximation of this data which fits in the main memory, but retains the essential features of interest. It converts the time-series numeric values to symbolic text.
Using SAX with Time Series Data:
The following graph (where in the X-axis represents time and the Y-axis represents reading values) shows time series data for which readings have been taken every five minutes bringing it to 288 data points per day:
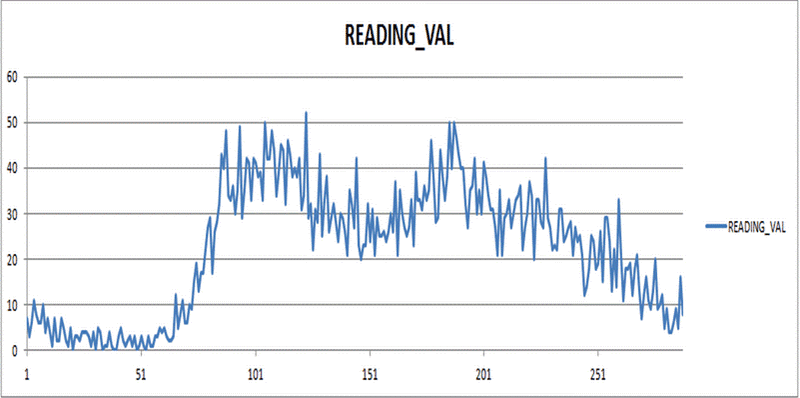
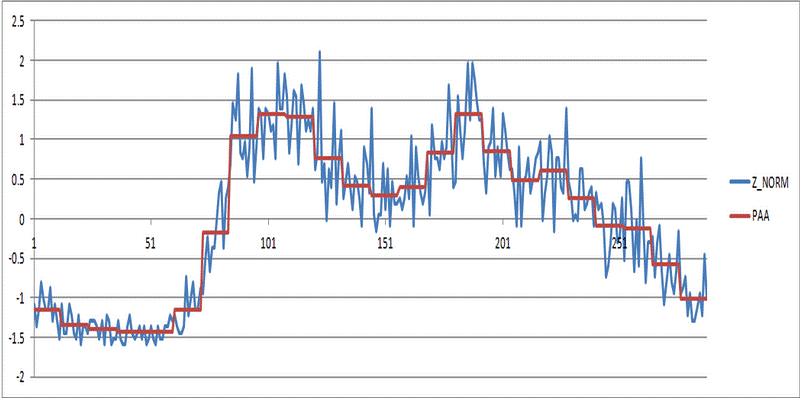
SAX is computed for time series data by first applying Z-normalization which converts the time series data with the mean value of zero. This standardizes the data to enable comparing shapes and patterns without losing the information in the original raw data.
The Piecewise Aggregate Approximation (PAA) of the time series is then calculated using the sample interval value and aggregating the points without losing the shape of the time series.
The following graph shows the time series data after Z-normalization and PAA:
The Y-axis is then divided into bands based on the alphabet size assuming the normal distribution of data across the Y-axis. The following graph shows four bands on the PAA of the time series:
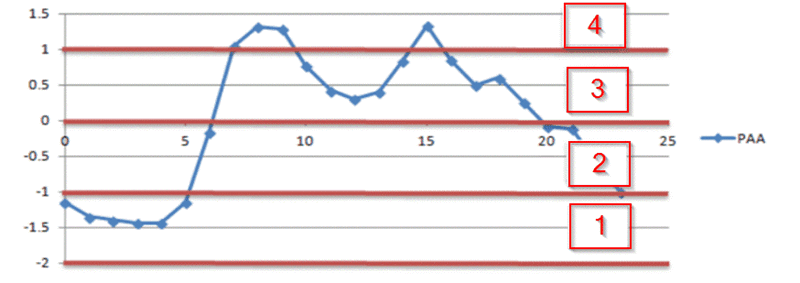
The time series after the computation of SAX is converted to the following symbolic text: 11111244433333433332222
This symbolic representation can be used for various data mining techniques.
For production analysis time series feature sets, the available advanced functions are:
-
SAX Bitmap Count: Depending on the SAX Bitmap size, the time series sequence is checked for the number of occurrences of the SAX Bitmap combination.
-
SAX Pattern Count: Depending on the user specified SAX pattern the time series sequence is checked for the number of occurrences of the specified SAX matching pattern. Users can specify patterns as regular expressions like, for example, 1234, 12, 132, and so on based on SAX alphabet size.
For machine event analysis time series feature sets, the available advanced function is:
-
SAX Pattern Alert: Depending on the user specified pattern, the time series sequence is checked for the specified pattern, and an alert is issued when it occurs.
-
The combination of each function (simple or advanced function) you select when you create a time-series features set becomes a feature or an event. For example, within the boundary of a step, if you have 3 fixed time segments, you will derive 3 features and each feature will be computed using the function. If the function selected was Average, then there will be 3 features as segment1-average, segment2-average, and segment3-average. These features, generated by time-series feature sets, are available as features during model building.
For example, if you give the time segment as Full, SAX Alphabet Size as 4, and the SAX Bitmap Size as 1, the following four features are extracted:
-
Full – SAX Bitmap (1)
-
Full – SAX Bitmap (2)
-
Full – SAX Bitmap (3)
-
Full – SAX Bitmap (4)
Similarly, if you give the time segment as Full, SAX Alphabet Size as 4, and the SAX Bitmap Size as 2, the following 16 features are extracted:
-
Full – SAX Bitmap (11)
-
Full – SAX Bitmap (12)
-
Full – SAX Bitmap (13)
-
Full – SAX Bitmap (14)
-
Full – SAX Bitmap (21)
-
Full – SAX Bitmap (22)
-
Full – SAX Bitmap (23)
-
Full – SAX Bitmap (24)
-
Full – SAX Bitmap (31)
-
Full – SAX Bitmap (32)
-
Full – SAX Bitmap (33)
-
Full – SAX Bitmap (34)
-
Full – SAX Bitmap (41)
-
Full – SAX Bitmap (42)
-
Full – SAX Bitmap (43)
-
Full – SAX Bitmap (44)
Basically, patterns in the time series data are matched with the SAX bitmap pattern (shown in brackets like 11, 12, and so on) and it can find the number of times it is matched in the time series data.
Process Flow

The process of setting up a time series feature set begins by choosing what you will use it for. You can use a time series feature set for:
-
Production Analysis: For data mining purposes, the features are extracted and used while building models for insights and predictions.
-
Machine Event Analysis: While alert information is directly obtained from the sensor devices, it can also be derived from time series sensor stream data by running the event identification processors.
-
-
Select the Time Segment which basically, within the boundary of a work order, operation, or step, divides the time series data in to fixed segments, sliding segments, and full time segments.
Note: For Machine Alert Analysis usage you can only select full time segments.
-
You can choose to select from the options available for either from Simple or Advanced functions.
-
View the features or events created from the combination of each time segment and each function. In data mining, features generated are used in model building. Note that events are used for deriving alerts from sensor stream data using the event identification processors.
-
Submit a Time Series Feature set. Later, you can select the set for use when setting up sensor devices.
See: Setting Up Time Series Feature Sets
Setting Up Time Series Feature Sets
Use the Time Series Feature Sets page to:
-
View existing time series feature sets.
-
Create a new time series feature set.
-
Update an existing time series feature set.
-
Delete an existing time series feature set.
-
Duplicate an existing time series feature set.
To view a time series feature set
-
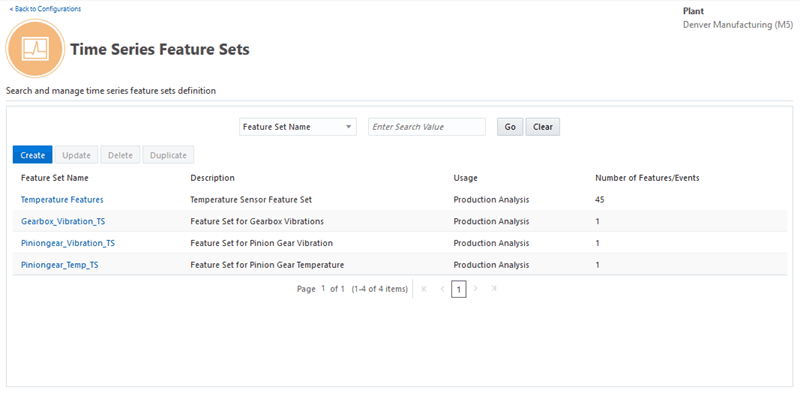
Navigate to the Time Series Feature Sets page.
From the Home Page, click Insights or Predictions. Click the Configuration link, then Time Series Feature Sets.
-
The existing time series feature sets display in the search results table in the Time Series Features Set page. Columns include:
-
Feature set name
-
Description
-
Feature set usage
-
Number of features/events
-
-
To view details of a specific feature set definition, click on a Feature Set Name value in the search results table. The View Time Series Feature Set page appears with the details of the time series feature set you selected.
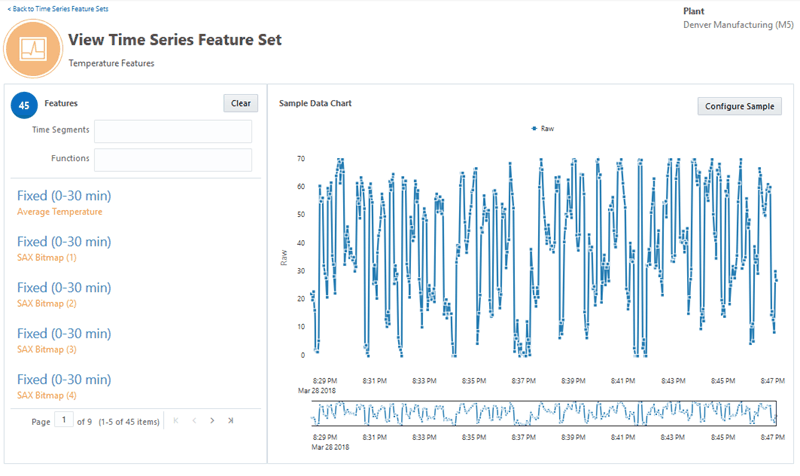
You can view the sample data chart and the time segment and function applied on the chart.
-
Click Configure Sample to select the range, interval and number of data points to be plotted on the sample chart. You can then view the raw chart and the value of the function based on the data points plotted on the chart. When the selected feature or event has SAX function, it shows the raw chart and the SAX chart to understand the function that is used.
To create a time-series feature set
-
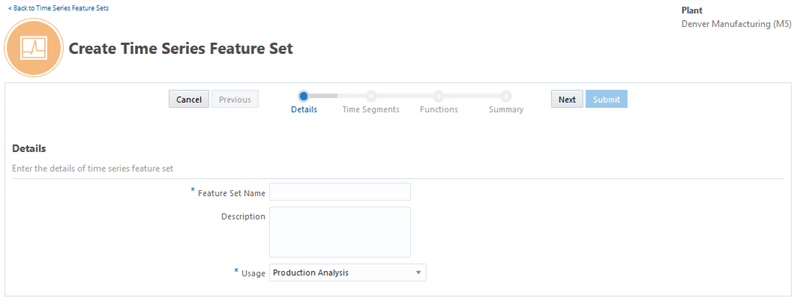
You can define and use time series feature sets using the Create Time Series Feature Set page. These time series feature sets definition can then be applied to time series contextualized stream data, making the data easier to use for analysis.
Navigate to the Create Time Series Feature Set page.
-
In the Time Series Features Set page, click Create.
-
Use the Create Time Series Feature Set page to enter the details, time segments, functions and view summary. Enter:
-
Feature Set Name
-
Description
-
-
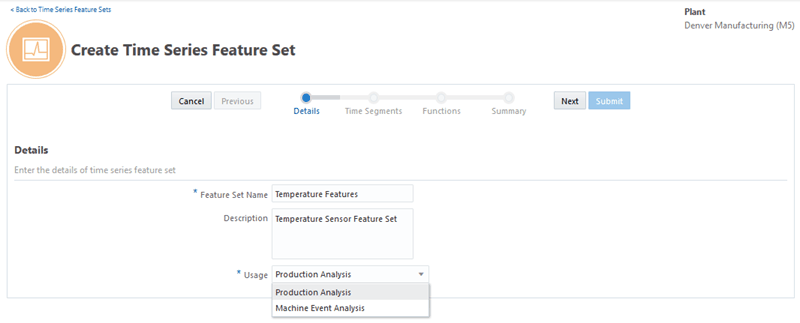
In the Usage field select from:
-
Production Analysis: To derive insights and predictions from the time series features, for data mining purposes.
-
Machine Event Analysis: To derive alerts from sensor stream data using the event identification processors.
-
-
Click Next.
-
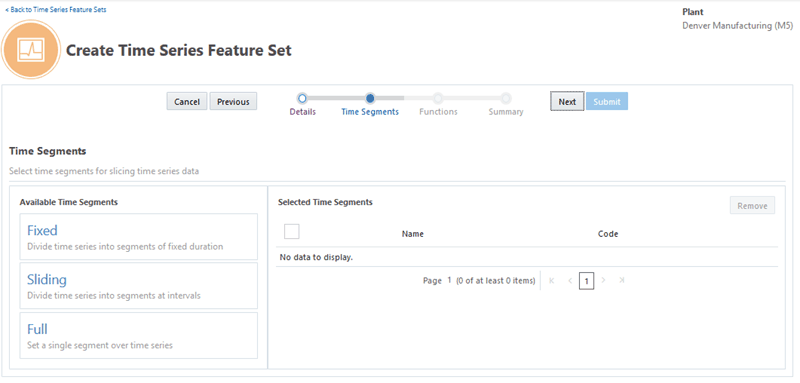
Select the time segment in the Available Time Segments region. Depending on the parameter defined, different time segments are generated. Choose from the following Time Segments:
-
Fixed
-
Sliding
-
Full
For production analysis, select from fixed, sliding, or full segments.
For Machine Alert Analysis you can only select full segment.
-
-
To select a fixed segment, click Fixed.
-
In Fixed Time Segments Settings, enter:
-
Name
-
Duration in minutes
-
Number of Segments
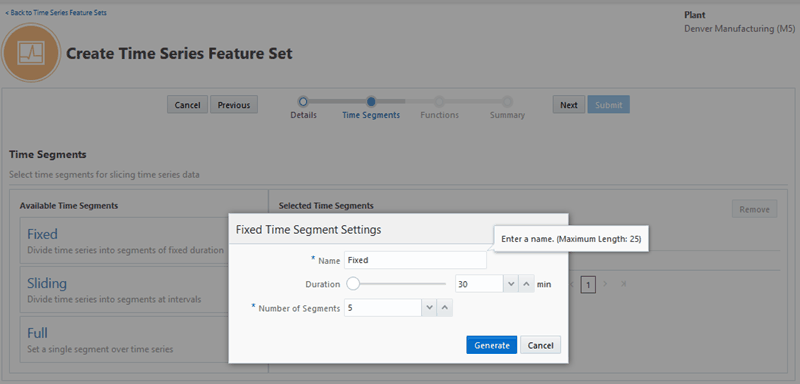
Click Generate to create the fixed time segment. Click Cancel to cancel your selection.
-
-
To select a sliding segment, click Sliding.
-
In Sliding Time Segments Settings, enter:
-
Name
-
Duration in minutes
-
Sliding Segment Interval in minutes
-
Number of Segments
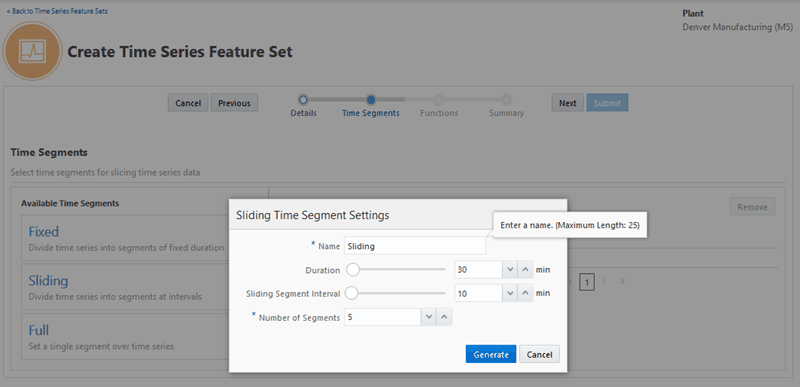
Click Generate to create the sliding time segment. Click Cancel to cancel your selection.
-
-
To select a full segment, click Full.
-
In Full Time Segment Settings, enter Name . There are no additional fields for full time segments.
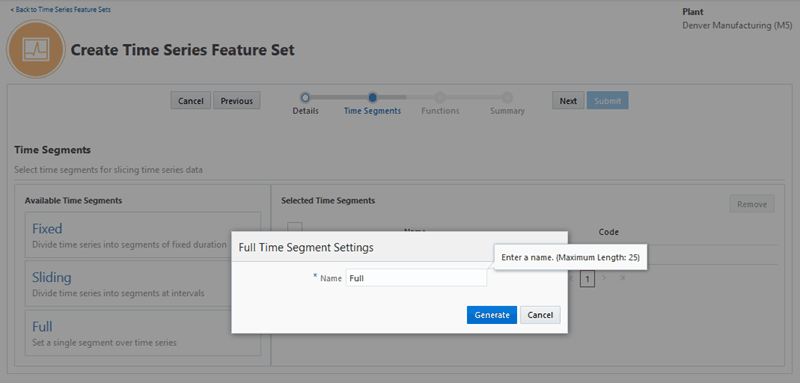
Click Generate to create the full time segment. Click Cancel to cancel your selection.
-
The time segments you generate appear in the Selected Time Segments region.
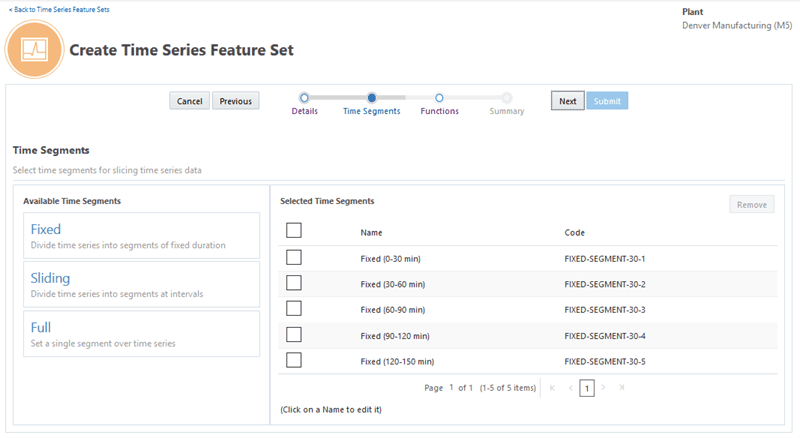
To remove a time segment, select the check box next to the time segment and click Remove.
Note: When you select a row in the table and select check box, all the associated time segments that were created along with the selected row are grouped and selected for removal.
-
You can select to update the time segment name only. Click the time segment name, enter your changes in settings and click Update.
-
Click Next.
-
Select a simple function from the list appearing in the Simple functions tab. Enter the parameters for the simple function you select, and click Generate.
For production analysis usage, click on any one of the following simple functions that appear as tiles:
-
Average
-
Standard Deviation
-
Minimum
-
Maximum
-
Count Above Threshold
-
Count Below Threshold
-
Count Within Range
-
Count Outside Range
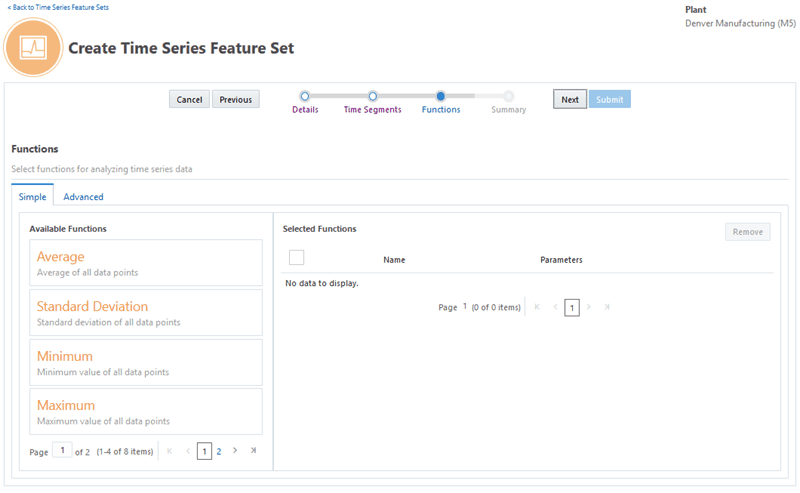
For production analysis usage, if you select Average, Standard Deviation, Minimum or Maximum, enter Name. There are no other parameters.
For production analysis usage, if you select Count above Threshold or Count below Threshold, enter:
-
Name
-
Threshold Value
For production analysis usage, if you select Count within Range or Count outside Range, enter:
-
Name
-
Range Start
-
Range End
For machine event analysis, select one of the following simple functions:
-
Above Threshold Alert
-
Below Threshold Alert
-
Within Range Alert
-
Outside Range Alert
For machine event analysis usage, if you select Above Threshold Alert or Below Threshold Alert, enter:
-
Name
-
Threshold Value
-
After Match - select Skip To Last or Skip to Next. The default value is Skip to Last.
-
Value Aggregation Function - select from Average, Minimum and Maximum. The default value is Average.
For machine event analysis usage, if you select Within Range Alert or Outside Range Alert, enter
-
Name
-
Range Start
-
Range End
-
After Match - select Skip To Last or Skip to Next. The default value is Skip to Last.
-
Value Aggregation Function - select from Average, Minimum and Maximum. The default value is Average.
-
-
The selected simple functions you generate appear in the Selected Functions region.
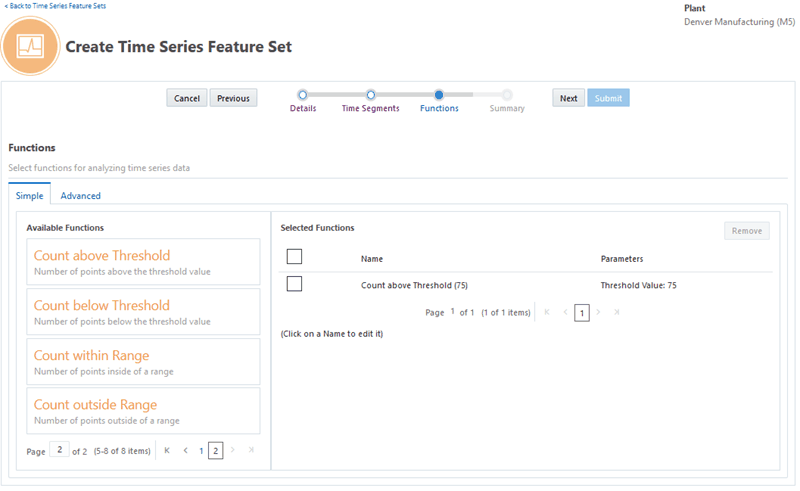
To remove a selected function, select the check box next to the simple function and click Remove.
-
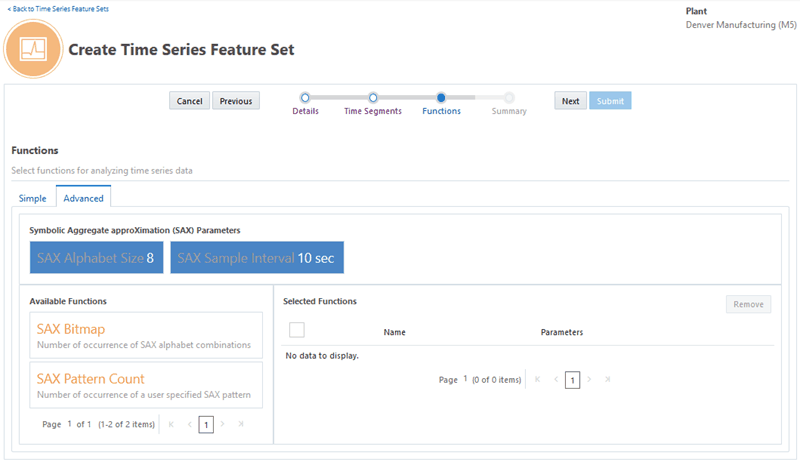
Click the Advanced tab to select an advanced function.
-
In SAX Parameters, select the size or number of SAX bands in the SAX Alphabet Size field. The number of bands supported are 4, 6 or 8. The default value is 8.
-
Select a value in the SAX Sample Interval field in seconds, minutes, or hours. The value should be greater than zero. The default value is 10 sec.
-
From Available Functions, select an advanced function. For production analysis usage, select from the following list of advanced functions:
-
SAX Bitmap Count
-
SAX Pattern Count
For machine event analysis, select the following advanced function:
-
SAX Pattern Alert
-
-
To select SAX Bitmap Count for production analysis, enter:
-
Name
-
Bitmap Size - select from 1 bit or 2 bits. The default value is 1 bit.
Click Generate to create the SAX Bitmap Count. Click Cancel to cancel your selection.
-
-
To select SAX Pattern Count for production analysis, enter:
-
Name
-
Pattern (regex) - enter an expression for the pattern match. The default value is 1234.
-
After Match - select Skip to Last or Skip to Next. The default value is Skip to Last.
Click Generate to create the SAX pattern. Click Cancel to cancel your selection
-
-
To select SAX Pattern Alert for machine event analysis, enter.
-
Name
-
Pattern (regex) - enter an expression for the pattern match. The default value is 1234.
-
After Match - select Skip to Last or Skip to Next. The default value is Skip to Last.
-
Value Aggregation Function - select from Average, Minimum, and Maximum. The default value is Average.
Click Generate to create the SAX pattern alert. Click Cancel to cancel your selection.
-
-
The selected advanced functions you generate appear in the Selected Functions region.
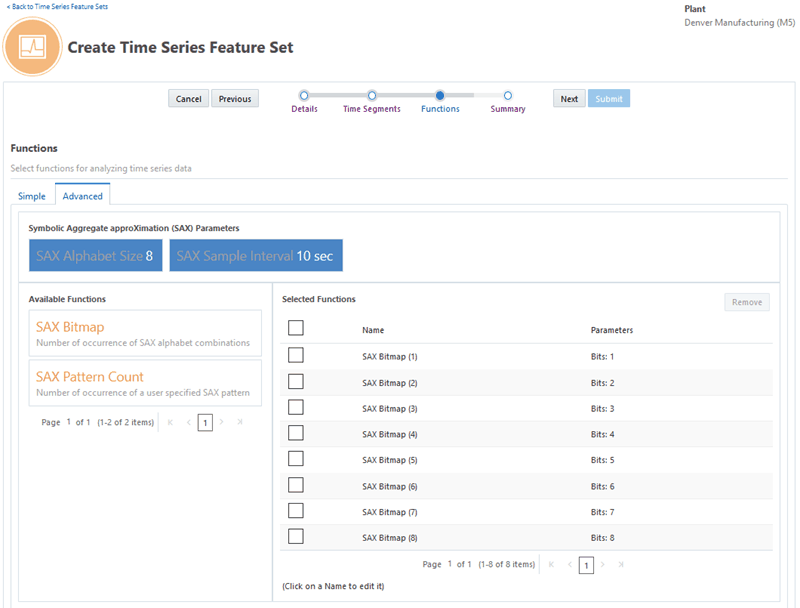
To remove an advanced function, select the check box next to the advanced function and click Remove.
Note: When you select a check box in the selected functions table, all the functions that were created along with it are grouped and selected for removal.
-
Click Next.
-
In the Summary, view the created features. The combination of each time segment and each function you select becomes a feature or an event.
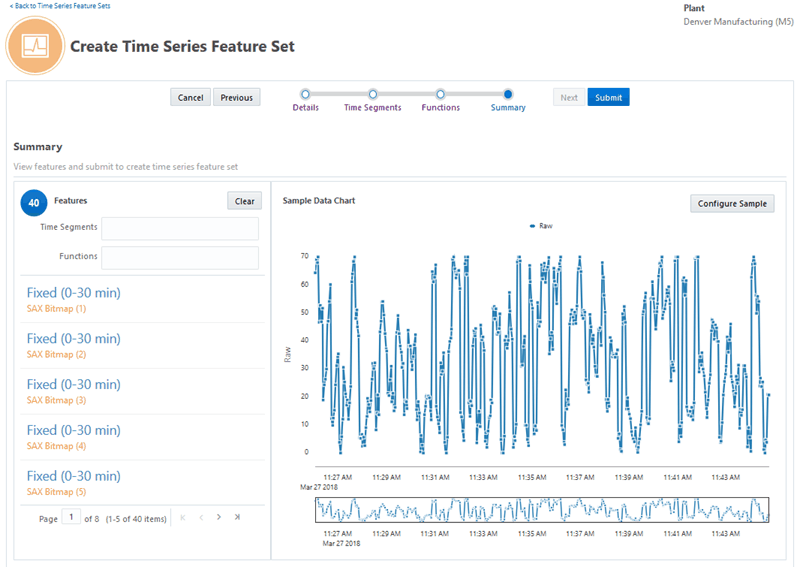
The Summary shows the number of features/events created from the combination of the time segment and function that you have selected. Click Features/Events tile to view the sample data chart.
You can filter the features/events that appears using the Time Segments field and/or Functions field.
The Sample Data Chart region shows the sample data chart and the time segment/function applied on the chart. SAX chart is displayed only when user selects the feature/event with SAX function.
-
Click Submit. Depending on the usage you have selected, you can now use the time series feature set you have created when creating sensor devices mappings for production analysis or machine event analysis of time series sensor stream data.
See: Setting Up Sensor Devices Mapping, Oracle Adaptive Intelligent Apps for Manufacturing Data Ingestion User's Guide.
To update a time series feature set
-
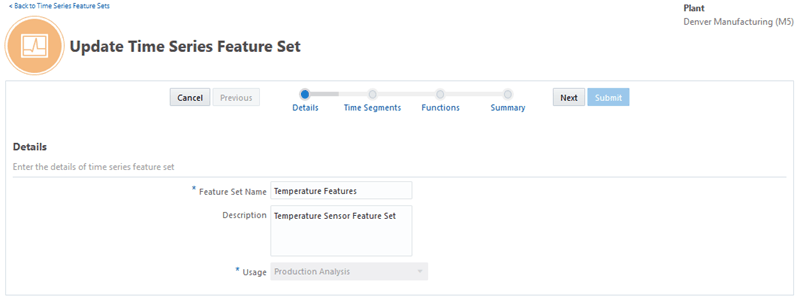
To update a time series feature set, navigate to the Update Time Series Feature Set page.
In the Time Series Feature Sets page, select the time series feature set you would like to update.
-
Click Update.
-
Update the Features Set Name and Description details of the time series feature set. Note that you cannot update the Usage field.
-
Update your selections for time segments and simple or advanced functions. View the summary information, and click Submit.
To delete a time series feature set
-
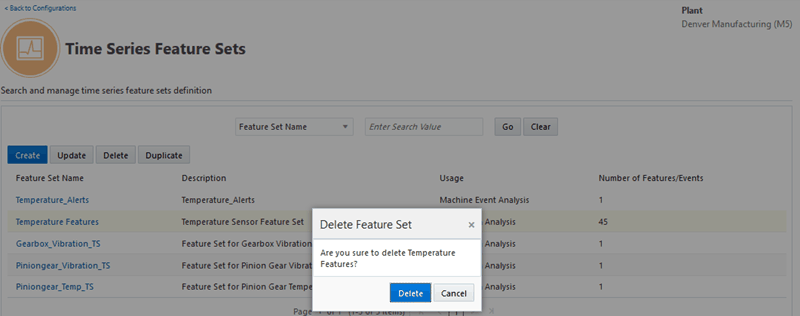
To delete a time series feature set, navigate to the Time Series Feature Sets page, select a time series feature set. .
-
Click Delete.
-
In Delete Feature Set notification that appears, click Delete. To retain the feature set, click Cancel.
To duplicate a time series feature set
-
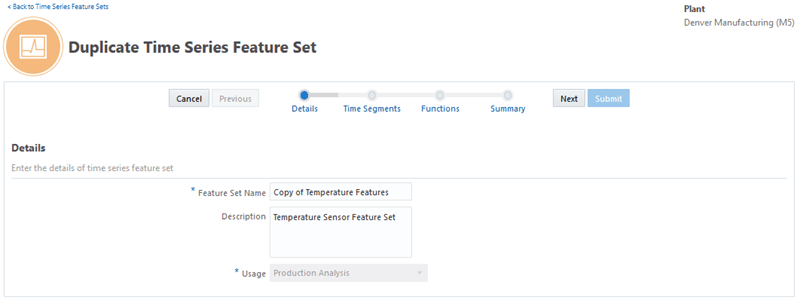
To duplicate an existing time series feature set, navigate to the Duplicate Time Series Feature Set page.
Select the time series feature set you would like to duplicate.
-
Click Duplicate.
-
Enter the Feature Set Name and Description details of the time series feature set. Note that the Usage field is copied from the time series feature set you duplicated and cannot be changed.
-
You can duplicate or change the selections for time segments and simple or advanced functions. View the summary information, and click Submit.
Defining Key Performance Indicators
Key performance indicators (KPI) are required for insights and prediction analysis in both process manufacturing and discrete manufacturing organizations. You can use the Key Performance Indicators page to define and manage setups for KPIs, model target attributes, and specify target bins for machine learning analysis. Note that the KPIs you define apply to all organizations.
Seeded Key Performance Indicators
The application supports the following four seeded KPIs:
-
Yield
-
Quality
-
Serial Unit Yield
-
Serial Unit Quality
Custom Key Performance Indicators
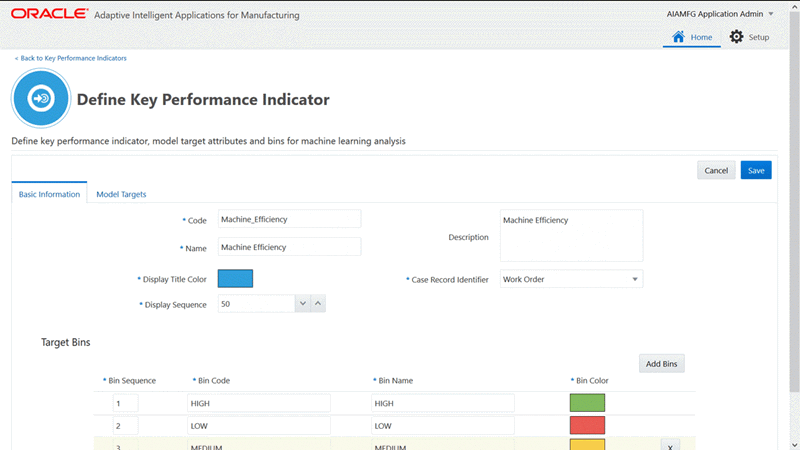
You can also create custom KPIs such as Cycle Time, Machine Efficiency, Machine Downtime and so on. You can map custom KPIs to attributes, and use them for Insights and Predictions analysis.
To define a key performance indicator
-
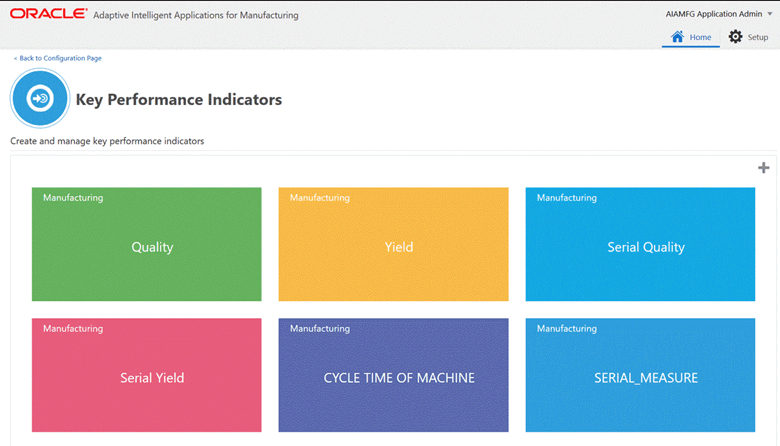
Navigate to the Key Performance Indicators page. From the Home Page, click Insights or Predictions. Click the Configuration link, then Key Performance Indicators.
-
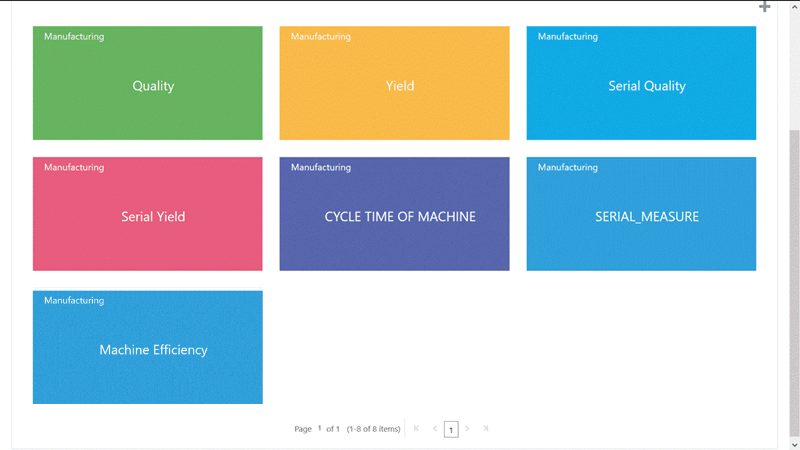
You can view the existing Key Performance Indicators as tiles, each representing a KPI that appear in the Key Performance Indicator page. All the KPIs defined, both seeded and custom, display for both process manufacturing and discrete manufacturing organizations.
KPI tiles appear in the order of the display sequence number you choose to set. If the display sequence number is common to one or more KPIs, then the tiles are arranged in ascending order of the KPI name.
-
To define a new KPI, click the Plus icon.
-
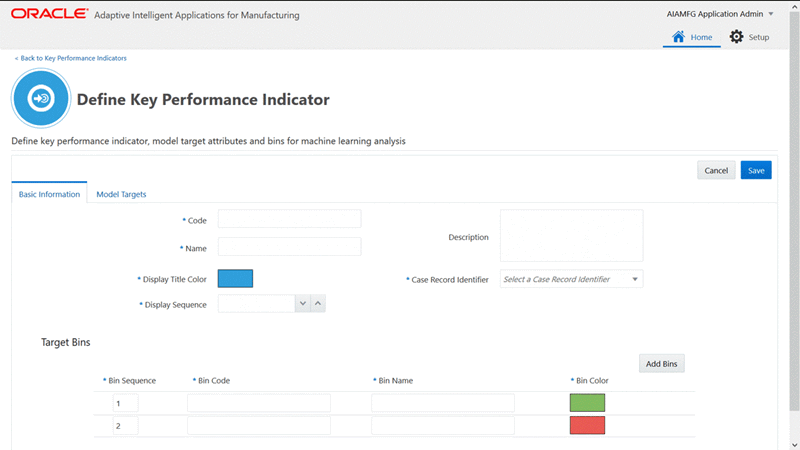
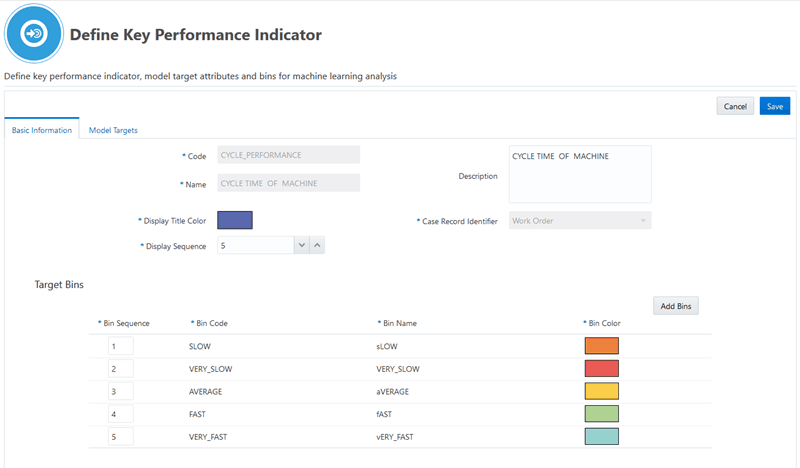
In the Define Key Performance Indicator page, use the Basic Information tab to add information for the following fields:
-
Code - Enter the KPI display code.
-
Name - Enter the KPI name. Note that you can only enter a name for a custom KPI and edit it till the output attribute is used by a dataset. Once it is used in dataset creation, this field will be read only.
-
Description - Enter a KPI description.
-
Display Tile Color - Select from the available color options to associate the KPI tile to a color.
-
Display Sequence - Select a value to arrange the KPI tile in a specific sequence in the ascending order.
-
Case Record Identifier - Select to specify if the KPI is for Work Order or Serial Unit level analysis.
-
-
Use the Target Bins region to add information for the following fields:
-
Bin Sequence - Enter a number from 1 to 5 and ensure it is unique within the KPI definition.
-
Bin Code - Ensure you enter a unique bin code for the KPI.
-
Bin Name - Ensure you enter a unique bin name for the KPI.
-
Bin Color - Ensure the color you select from the available options is unique within the KPI definition.
You must define a minimum of two bins. To enter more than two bins, click Add Bins and enter information for the bin. You can add a maximum of five bins. You can change and delete bins until they have been used with a data set.
-
-
Optionally, to map a target to the KPI, in the Model Targets tab, click Add Attribute.
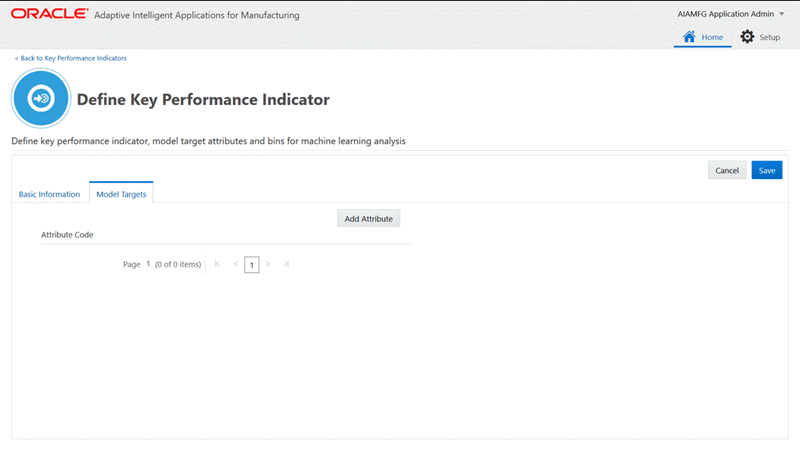
You can select a seeded attribute to associate and map to a KPI in the Model Targets tab or enter a custom attribute code. If you map an attribute to a KPI, then during dataset creation, when you select an attribute as a target in the Create Dataset user interface, the key performance indicator association will default from this mapping.
Note: Seeded attributes will not be available to be associated as targets for the Serial Unit Yield KPI.
-
Select a seeded attribute code or enter a custom attribute code in the Attribute Code field.
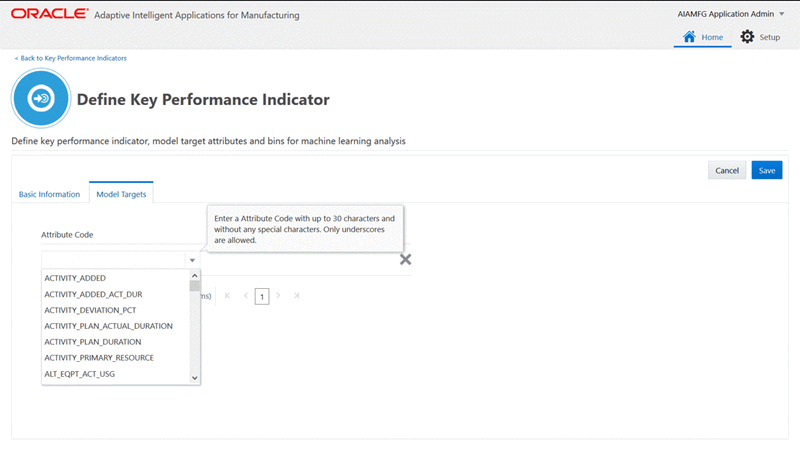
Note that once an attribute is selected, mapped to a KPI, and used in a dataset, the attribute cannot be deleted or associated with any other KPI.
If the attribute is not mapped during KPI definition, but is chosen as a target when creating a dataset and mapped to a KPI, then the attribute is automatically mapped to the KPI and is displayed in the Define Key Performance Indicator page for the KPI.
-
Click Save.
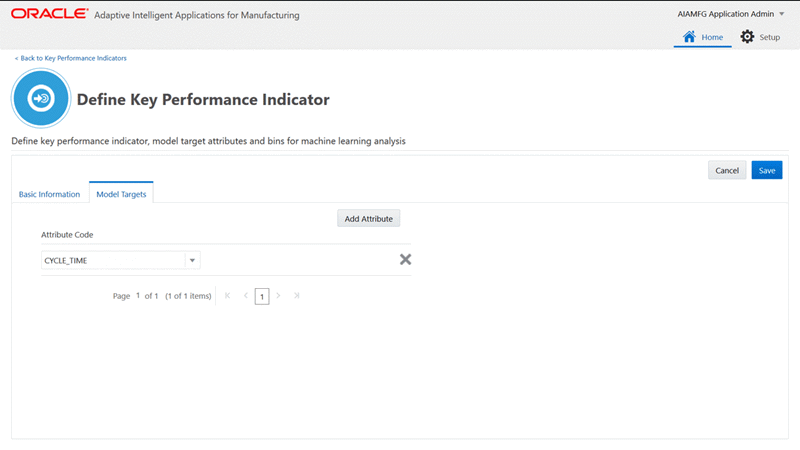
-
Once you save the details of the custom KPI, you will be returned to the Key Performance Indicators page where a message displays that the KPI has been successfully created.
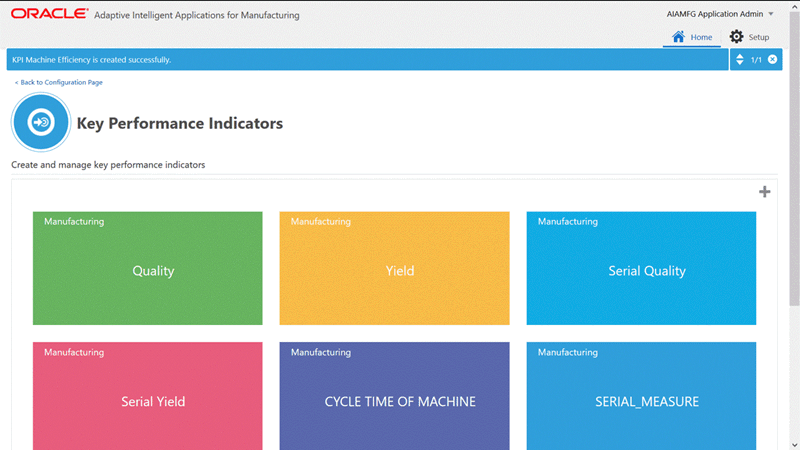
View the custom KPI you created which now appears as a tile in your selected display tile color. The tile position is based on the display sequence entered in the KPI definition.
To edit a key performance indicator
-
To edit a key performance indicator, in the Key Performance Indicators page, click the KPI tile you want to edit. The details of the KPI displays in the Define Key Performance Indicator page.
-
For custom KPIs and the seeded Yield, Quality, and Serial Unit Quality KPIs, you can edit the KPI depending on whether any of the targets associated to the KPI is used in a dataset.
As long as any targets associated to a KPI are not used in a dataset, except for the seeded Serial Unit Yield KPI, you can:
-
Update KPI name, description, sequence, color.
-
Add bins (only 5 bins are allowed).
-
Remove bins.
-
Update bin name, sequence, and color.
-
Add or remove attributes.
If any targets associated to a KPI are used in a dataset, except for the seeded Serial Unit Yield KPI, you can:
-
Update the KPI description, sequence, and color.
-
Add bins (only 5 bins are allowed).
-
Change bin sequence and color.
-
Add attributes.
For the seeded Serial Unit Yield KPI, you cannot update the KPI definition and bin definition. You can add or delete a model target associated to the KPI, but you cannot delete a model target after the dataset is created. Any model target associated with the Serial Unit Yield KPI must have a value of 1, 2, 3, or 4.
-
-
Once you complete your updates for a KPI, click Save.
Creating Datasets for Analysis
Specify context information when creating a dataset. The context information includes criteria to identify a subset of historical transactional data, such as the product, recipe, routing, and work order completion date range. This dataset submission establishes the data features and extracts the actual data from source systems.
The dataset you create performs two actions:
-
Extracts the out-of-the-box input features and targets such as operation duration, material quantities, quality results, resource usage, and custom features, defined as flex attributes. The input features and target attribute metadata information are extracted from all of the related ERP structural entities and time series data in the context of a product, recipe, routing and work order completion date range.
-
Extracts the data for the selected input features and target attributes.
You must create a dataset before creating a model. When you create a model, you specify which dataset to use as input for analysis.
Use the Data Preparation page to:
-
Create new datasets.
-
View existing dataset information.
To create a dataset
-
Navigate to the Data Preparation page.
From the Home page, click Insights or Predictions, and then click the Data Preparation link.
-
In the Data Preparation page, click Create to create a dataset for analysis.
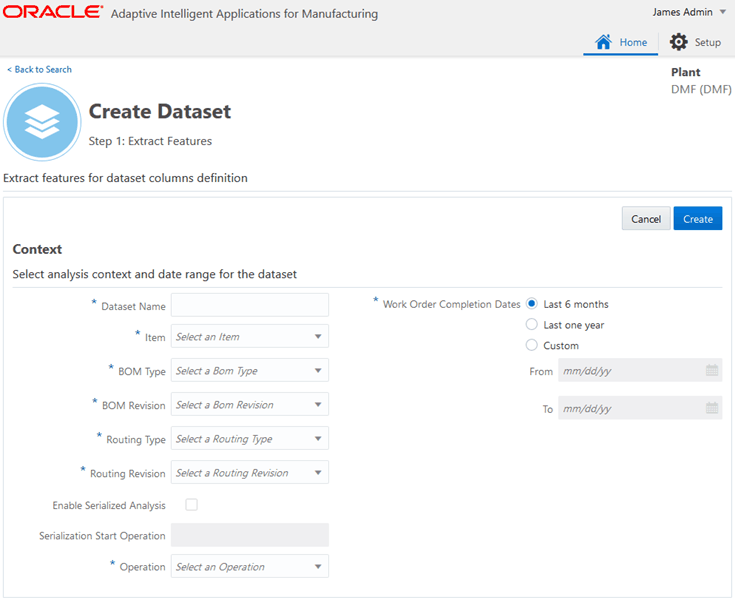
Creating a dataset involves the following two steps:
-
Step 1: Extract Features. Select analysis context and date range for the dataset.
This step defines the analysis context for a dataset and specifies the date range.
-
Step 2: Select Target Attributes and Features. Select target attributes and features for dataset definition.
Select the attributes that become target output measures and input features for the dataset.
Important: You can only complete step 2 if work orders or serial units exist for the selected context in the step 1.
-
-
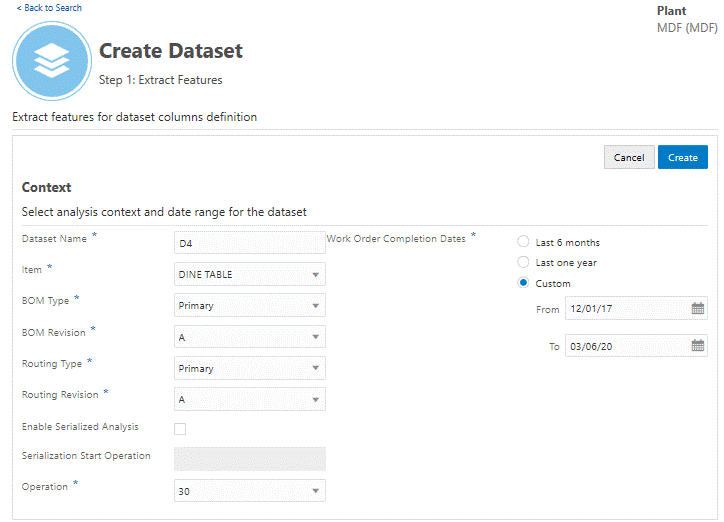
Begin by entering the following mandatory information in the Context section:
-
Dataset Name - Enter the name of the dataset.
-
Item - Select an assembly/production item from the list.
For Process Manufacturing
-
Item Revision - Select an existing item revision from the list.
-
Recipe - Select an existing recipe for the item/item revision from the list.
-
Recipe Version - Select an recipe version for the item recipe from the list.
-
Operation - Select an operation defined in the routing for the recipe selected above. All of the out-of-the-box features and flex attributes pertaining to all operations in the routing are extracted. See: Model Features for Process Manufacturing.
For Discrete Manufacturing
-
BOM Type - Select a primary or alternate BOM for the item from the list.
-
BOM Revision - Select a BOM revision for the BOM type from the list.
-
Routing Type - Select an existing item routing.
-
Routing Revision - Select a routing revision for the routing type selected above.
-
Operation - Select an operation defined in the routing selected above. All of the out-of-the-box features and flex attributes, up to and including this operation, are extracted. See: Model Features for Discrete Manufacturing.
Discrete Serialized Manufacturing-Only Fields
-
Enable Serialized Analysis - Automatically enabled if the item and routing type entered above are serialized. Optionally, you can disable serialized analysis if you want to predict results using an operation that occurs before the serialization start operation. If the serialization start operation is the first operation in the routing, then you can not disable serialized analysis.
-
Serialization Start Operation - Automatically selected based on the serialized item and routing type entered above. This is a display only field.
-
-
Work Order Completion Dates - Select the date range of work orders by completion date that you want to analyze the data.
Additional Information: If Enabled Serialized Analysis is checked, then this field name becomes Serial Unit Completion Dates.
-
-
Click Cancel to cancel the dataset creation request. Click Create.
This submits a background request. The dataset is now listed in the Data Preparation page with a status for the Dataset as PENDING or the Feature Extraction as ERROR. If you receive an error status, then view the run details for the request from the Background Process page.
-
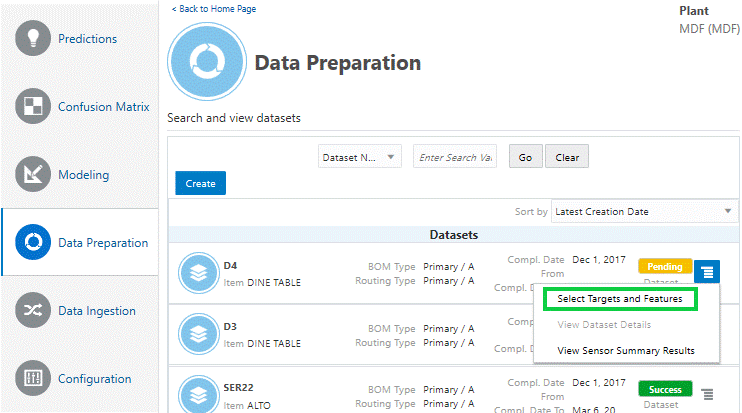
Select the Action link for your new dataset, then click Select Targets and Features.
-
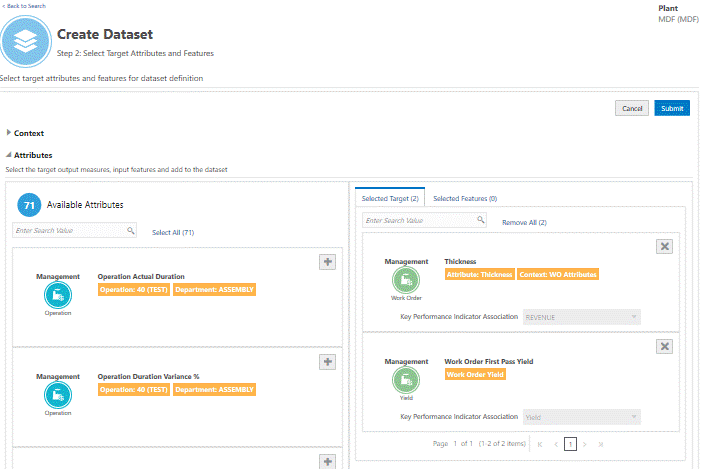
Select the attributes that you want to use as targets. On the right side of the Create Dataset page, verify that the Selected Targets tab is selected. On the left side, click the + icon next to each available attribute you want to use as a target output measure.
-
Search for attributes by:
-
Category
-
Subcategory
-
Key Performance Indicator
-
Attribute Name
-
Entity
-
-
You can only select an attribute as a target output measure if it is associated to a KPI and if the attribute has a numerical data type.
-
No more than 30 attributes can be selected as targets.
-
Only attributes with operations on or before the context operation are allowed as input features.
-
Only attributes with operations on or after the context operation are allowed as targets. Targets are by default associated to a KPI according to the KPI definition. If a target is not associated to the KPI already, you can associate it to any of the seeded or custom KPI defined.
Note: For the Serial Unit Yield KPI, you can associate only the seeded targets (Serial Unit Yield and Serial Unit Operation Yield) and custom attributes as long as they hold the distinct values, 1,2,3,4 in their data.
Tip: If you use the Select All link, only the eligible attributes are selected as target output measures. You can use the X icon to remove an individual attribute as a target.
-
-
Select the Selected Features tab before adding attributes as input features. Click the + icon next to each available attribute you want to use as an input feature.
-
You can select up to 450 categorical features and 450 numerical features.
-
You can only use attributes with operations on or prior to the context operation as input features.
-
-
Click Cancel to cancel step 2. Click Submit.
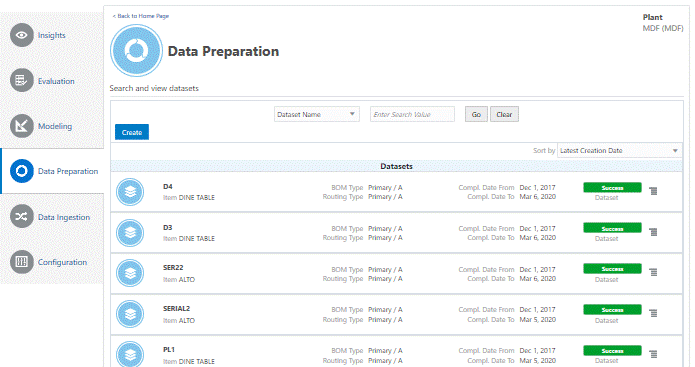
After submitting the dataset background request, the dataset is displayed in the Data Preparation page with a dataset status as IN PROGRESS. When the dataset has been created, the status changes to SUCCESS. You can then use the dataset to create a model.
If the dataset status changes to ERROR, navigate to the Background Process page to view the run details. See: Running Background Processes.
To view dataset information
-
Navigate to the Data Preparation page.
From the Home page, click Insights or Predictions, and then click the Data Preparation link.
The existing datasets display in the search results table of the Data Preparation page.
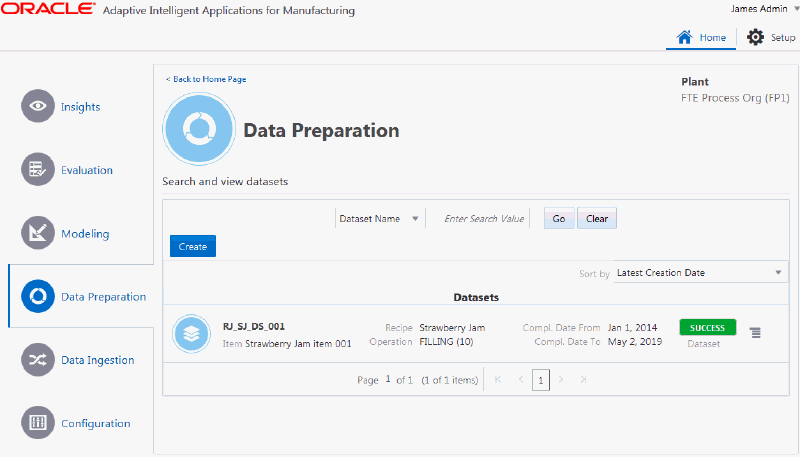
Use the Sort by field to sort the datasets by name or latest creation date.
You can also search for datasets using the following criteria, depending on the organization type:
Discrete Manufacturing Organization Criteria
-
Dataset Name
-
Item
-
BOM Type
-
Routing Type
-
Feature Extraction Status
-
Dataset Status
Process Manufacturing Organization Criteria
-
Dataset Name
-
Item
-
Recipe
-
Feature Extraction Status
-
Dataset Status
-
-
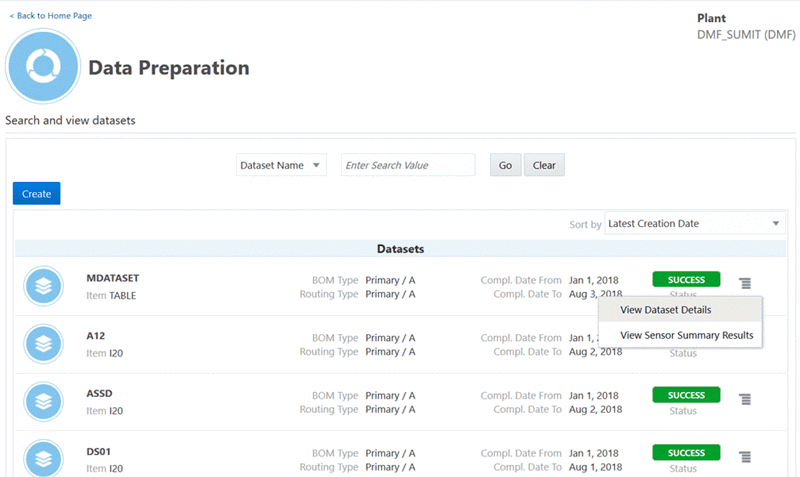
To view detailed information for a datatset, use the Action link for a specific dataset and click View Dataset Details.
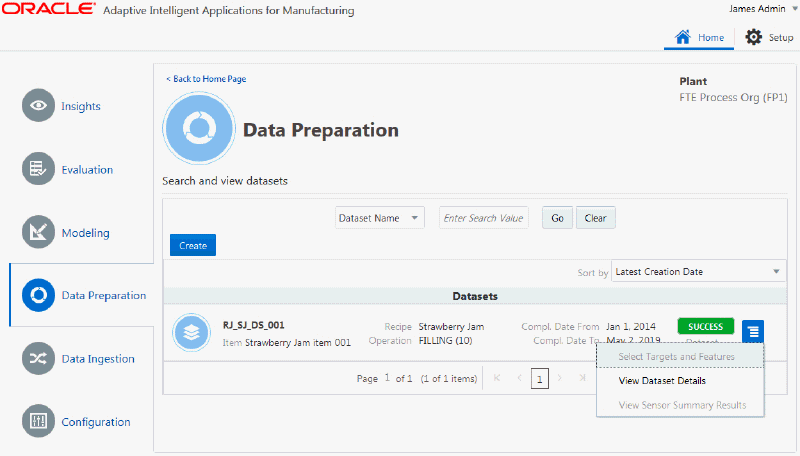
-
You can use the Dataset Information page to review details of the context information of the dataset you selected.
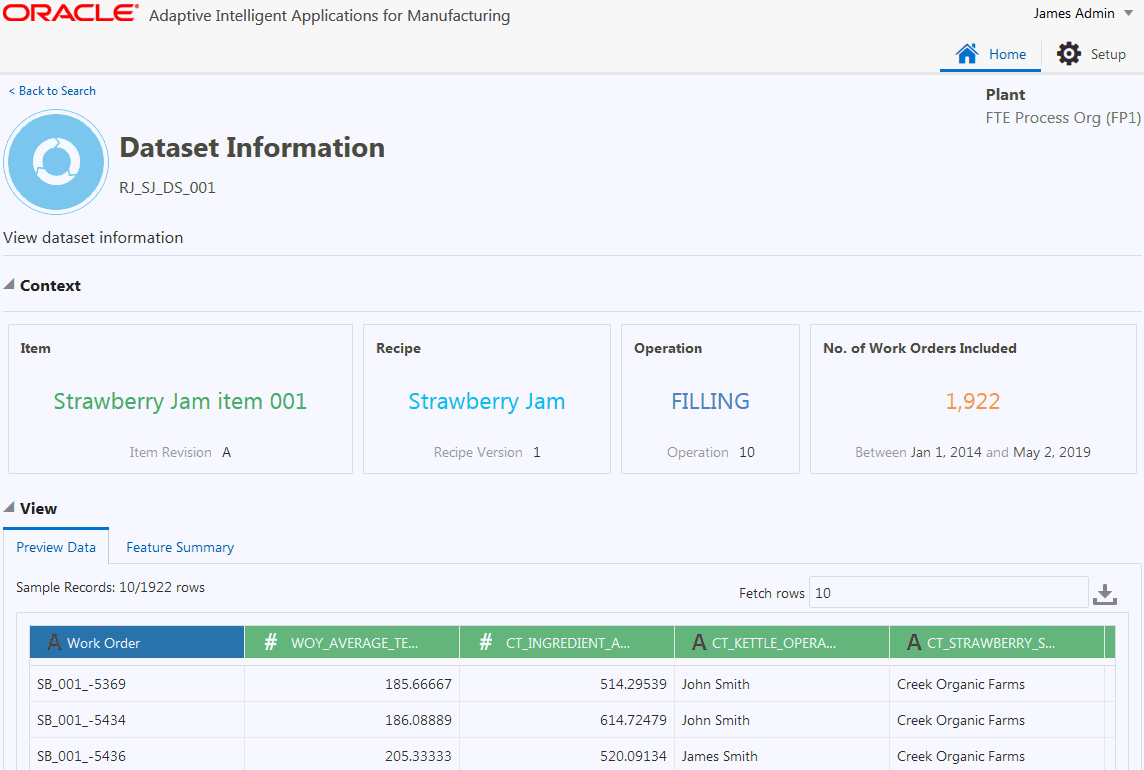
-
You can use the View region of the Dataset Information page to see the dataset details. The Preview Data tab displays case record identifiers, input features and targets for the dataset.
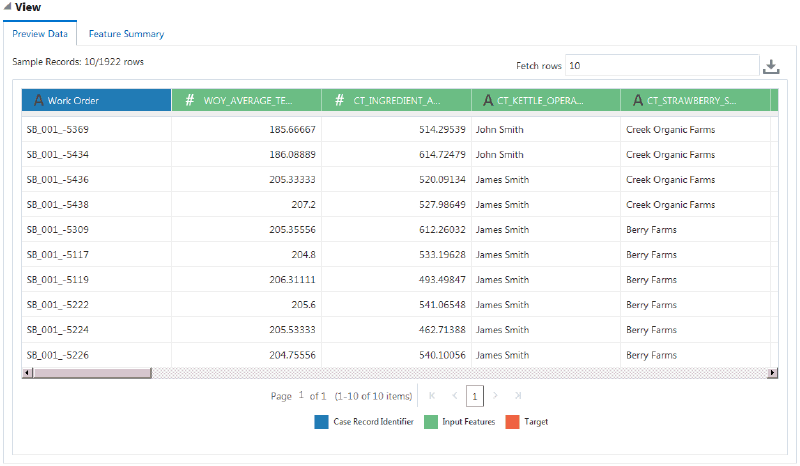
You can use the link in each column header to view additional details of the input feature or target attribute.
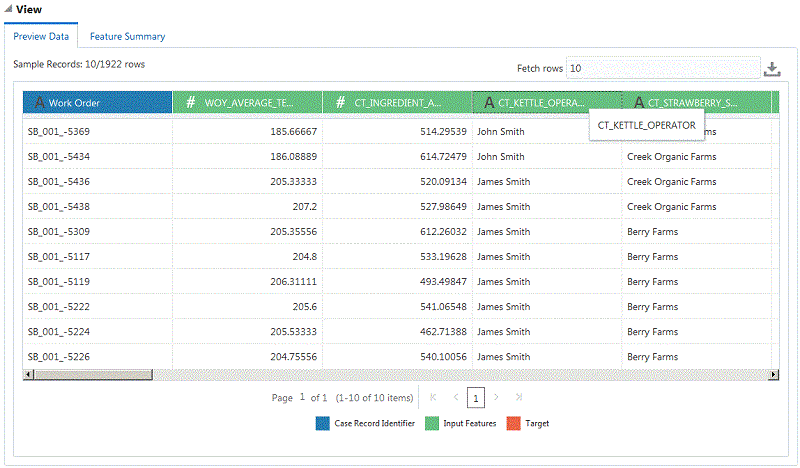
-
Use the Feature Summary tab to view the data distribution and details of input features and target attributes.
Click in the Features field, then select a category, subcategory or feature from the drop-down list to narrow the list of features displayed.
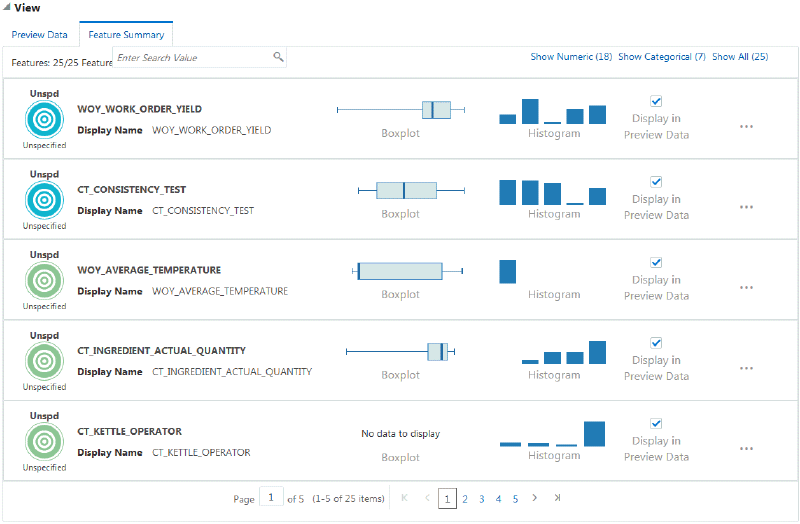
Click the Boxplot to learn which two quartiles contain the most data points.
Click the Histogram to discover the frequency distribution of data points across up to 10 frequency ranges.
You can select the input feature or target attribute you would like to appear in the Preview Data tab using the Display in Preview Data check box.
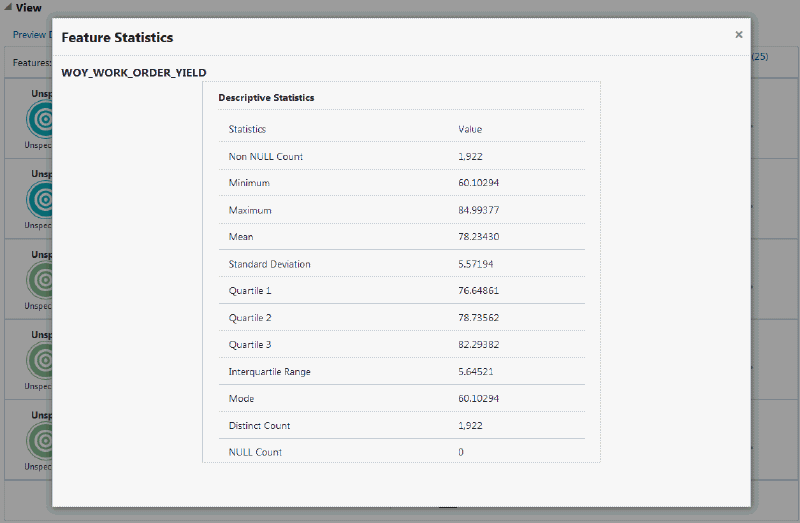
Click the ellipsis points (...) to view additional statistics for an input feature or target attribute.
Viewing Sensor Summary Results
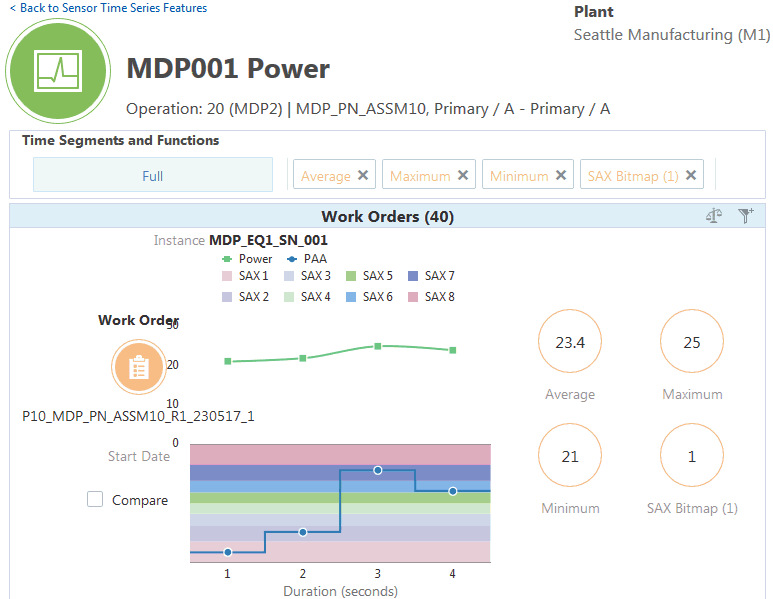
After the successful creation of dataset, you can view the time series features generated according to the time segments and functions applied to the contextualized sensor stream data used in the request. The time series features are created for all equipment process parameters with an assigned time series feature set. You can drill into a specific process parameter to understand and compare the summary function values of features across the work orders in the context.
To view sensor time series features
-
From the Home Page, click Insights or Predictions, and then click the Data Preparation link.
-
In the Data Preparation page, the existing datasets appear in the search results table. To view time series features for a dataset, click View Sensor Summary Results from the Actions link.
-
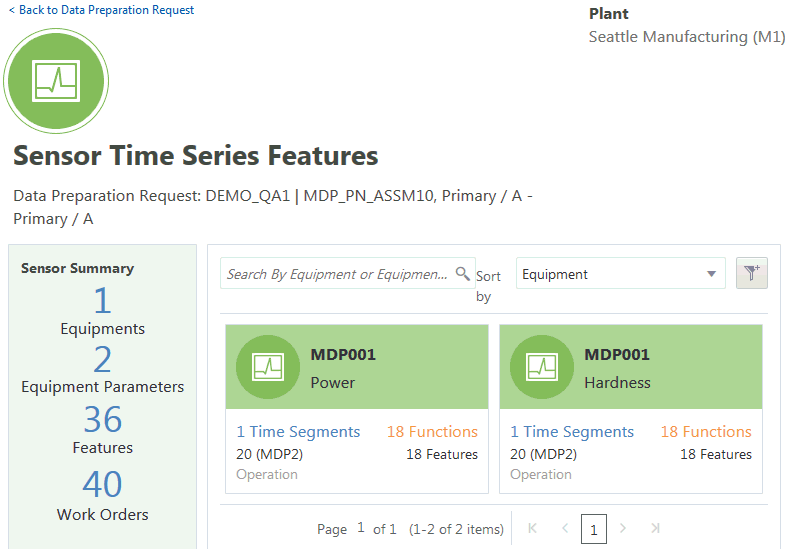
In the Sensor Time Series Features page, you can sort the results by Equipment, Equipment Parameter, Time Segments, and Functions.
-
You can view the number of time segments, the number of functions, and the total number of features for an equipment instance and equipment parameter based on the time series features set definition.
To view sensory summary results
Click on any parameter to review the sensor summary results. This page enables you to filter by a time segment and functions defined for that parameter. This enables you to review the computed sensor summary values across work orders or serial units considered in the context.
-
View sensor time series data points for a selected time segment.
-
View the Symbolic Aggregate approximation (SAX) format of the sensor time series data for each work order or serial unit in the context. This helps you to visually understand the patterns in the time series data.
-
View the sensor summary function values for each work order or serial unit in the context.
-
Select multiple work orders and click on the compare icon to view and compare the sensor summary function values across the selected work orders or serial units.
