Configuring flag summary items
For a flag summary item, on the Define Flags tab of the Summarization Bar edit view, you select the dimensions and set up the metric conditions.
If you select multiple dimensions, then the conditions are applied to combinations of those dimension values.
For example, if you select the product category and region dimensions, and set the flag condition to total sales greater than 500, then the flag summary item displays if any combination of product category and region has total sales greater than 500.
To configure a flag summary item:
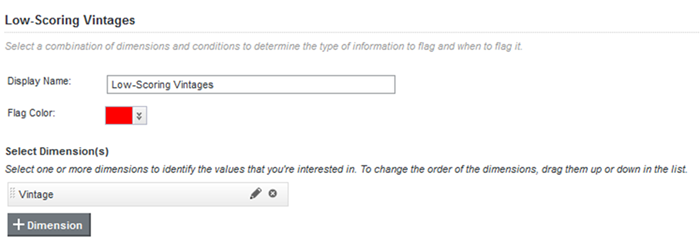
- In the Display Name field, type the text to display on the summary item.

The display name is also used as the name of the summary item.
- From the Flag Color list, select the background color to use for the number of values that match the flag criteria.
- To add a dimension to the flag summary item:
- Click + Dimension.
- On the Select a Dimension dialog, click the dimension you want to use.
- Click Apply.
If you select a date/time attribute as a flag dimension, then by default, Studio uses the largest available date/time subset. For example, if the attribute has Year, Year-Month, and Year-Month-Day enabled, then the Year subset is used.
- The dimension values are applied in the order they are listed. To change the order, drag each dimension to the appropriate location in the list.
- To remove a dimension from the list, click its delete icon.
- Use the Define Conditions list to select the list of conditions that must be met in order for the flag summary item to display.
A flag summary item is only displayed on the end user view if at least one value matches all of the conditions in the list.

- To add a condition to the list, click +Condition.
- To remove a condition from the list, click its delete icon.
- To change the order for applying conditions, drag and drop the conditions to the appropriate location in the list.
- For each condition in the Define Conditions list:
- From the Condition Based On list, select whether the condition is based on:
- A single metric value. For example, display the flag summary item if any of the dimension values have more than 500 sales.
- A ratio of two metrics. For example, display the flag summary item if the total sales for any of the dimension values is greater than 90% of the projected sales.
- To select a metric, click Select Metric.
- To select a different aggregation method for a metric, you can use the list next to the metric name. You cannot select a different aggregation method for a predefined metric.
- In the Threshold column, configure the condition comparison. From the list, select the comparison operator, then in the field or fields, type the comparison value or values.
- From the Condition Based On list, select whether the condition is based on:
- To configure a dimension or metric:
- Click its edit icon.
- For date/time dimensions, from the Date/time Subset list, select the date/time subset to display on the component.
By default, the largest available subset is used.
- For metrics that are not predefined, the configuration dialog includes a list to select the aggregation method.
- For both metrics and dimensions, the Value Formatting section allows you to customize the format of the displayed value.
For details on customizing a displayed value on a component, see Configuring attribute value formats.
- Under List of flags:

- In the Max number of flags to display field, type the maximum number of flags to display when users click the flag summary item.
For example, even if 20 dimension values match the flag conditions, you can restrict the list of flags to only show 10.
- In the Overview content field, type a brief description to display above the list.
- In the Max number of flags to display field, type the maximum number of flags to display when users click the flag summary item.
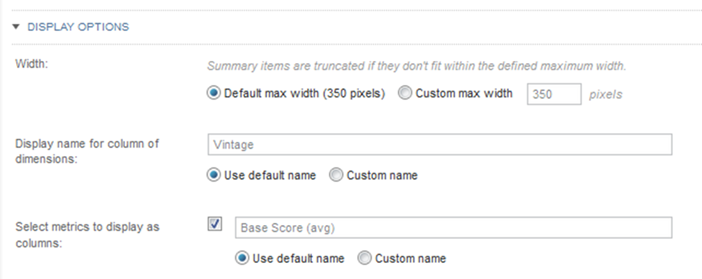
- Under Display Options:

- Under Width, to customize the maximum width of the item, click Custom max width, then in the field, type the width in pixels.
- Under Display name for column of dimensions, specify the column heading for the dimension column on the list of flags.
By default, the dimension names are used. To specify a custom name, click Custom name, then in the field, type the custom heading.
- Under Select metrics to display as columns, to include the metric values in the list of flags, check the check box.
- If you are displaying the metrics, then to customize the column heading for the metric values, click Custom name, then in the field, type the custom heading.
- In the Actions section, configure the page to display when end users refine by a dimension value in the list of flags.
For information on configuring a target page for refinement, see Selecting the target page for a refinement or hyperlink.