Setup and Administration
Overview of Setup and Administration
A number of tasks are performed to set up In-Memory Cost Management Cloud Service. Several of these tasks are set up in the Administration region. The Administration region provides three administrative related areas for managing your organization including Background Processes, Security, and Configuration. The following is a list of tasks to be performed for setup:
-
Installation: See: Installing In-Memory Cost Management Cloud Service
-
Application Roles: An application role provides user access to or restrictions for functions, see: Application Roles
-
User Access: The Security page is used to set user access by organization, see: Security
-
Parameter Definition: The Configuration page is used to set values for parameters and specifying how In-Memory Cost Management Cloud Service processes data. See: Configuration
-
Formatting: The Cost Impact Simulation and Cost Comparison pages use Oracle Smart View for Office with Microsoft Excel for investigating costing data in your organization. For improved readability, you can set spreadsheet cell style color and text options appearing in the worksheets you create. See: Smart View Cell Formatting
-
Data Sources: You connect directly to active connections through the Smart View panel, see: Connecting to Data Sources
Application Roles
An application role comprises a set of privileges determining what users can see and do. The assigned role provides user access or restrictions for functions. For example, in order to use the Gross Profit Analyzer and the Impact on Gross Profit dashboards, you need to be assigned the specific profitability role. If this role is not assigned, access is denied. Administrators configure what users see and do in Oracle Analytics Cloud in the Application Role Management page. See: Managing What Users Can See and Do, Oracle Cloud Preparing Data in Oracle Analytics Cloud
The following application roles are available in Oracle In-Memory Cost Management Cloud Service:
| Name | Display Name | Description | Accessible Functionality |
|---|---|---|---|
| CMI_BACKGROUND_JOB_ROLE | Background Jobs Role | Background Jobs Role - In Memory Cost Management | Enables access to the Background Process region of the Administration page. Users with this role can schedule, submit, and search background process jobs. |
| CMI_INTEGRATOR_ROLE | Integrator | Integrator - In Memory Cost Management | Enables access to the REST web services APIs. |
| CMI_PLANNING_ROLE | Cost Planner | Cost Planner - In Memory Cost Management | Enables access to the Cost Planning features including creating and searching cost plans, allocation pools, allocation scopes, and allocation rules. This role also enables users to access cost plan analyzer reports. |
| CMI_PROFITABILITY_ROLE | Profitability Analyzer | Profitability Analyzer - In Memory Cost Management | Enables access to the profitability dashboards - Gross Profit Analysis and Impact on Gross Profit. This role is also required for the Oracle Analytics Cloud Service Suite for the user. |
| CMI_SIMULATOR_ROLE | Cost Simulator | Cost Simulator - In Memory Cost Management | Enables access to simulation and cost comparison functionality. |
| CMI_ADMIN_ROLE | Administrator | Administrator - In Memory Cost Management | Enables access to all functionality including organization access security and configuration setup. |
To add a user and a role for Oracle Analytics Cloud Service Security Access
-
Navigate to the Oracle Analytics Cloud Console.
-
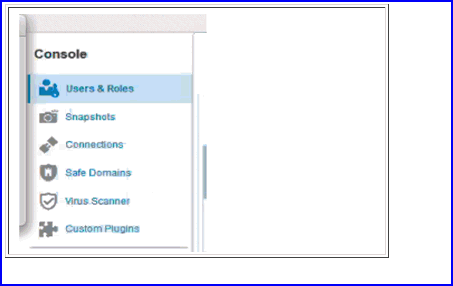
Select Users & Roles.
-
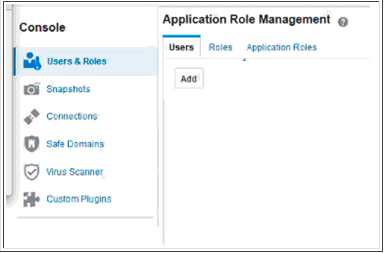
To add a user, select the Users tab and click Add.
-
Enter the following information:
-
User name used to sign in
-
User's first name and last name
-
A default password
The user enters this default password the first time they sign in, and need to change this password as soon as possible.
-
-
Save your work.
-
Select Application Roles from the menu for this user.
-
Select Roles, and click Add.
-
Enter the name for the role, or select Search to specify the roles this user is allowed to do.
Important: For employees using the Gross Profit Analyzer and Impact on Gross Profit dashboards, assign the CMI_PROFITABILITY_ROLE.
-
Save your work.
Security
The Security region enables you to define and regulate data access for user roles and organizations. You can:
-
View the organization list associated with users
-
Add and remove organization access
To search and set user role access
-
Navigate to the Security page.
All the user records appear in the Search and select user column.
-
Enter a User Name, or a portion of a user name, and select the Search icon to filter the record display.
The results of your query appear on the page.
For the selected record, the Organization Access for Admin section displays organizations for which access is granted with a check mark, and organizations for which access denied with an X.
-
You can filter this list by entering search criteria for either Organization Code or Organization Name, and selecting the Search icon.

-
Enable the List Organizations with User Access check box to view only the organizations the selected user has access.
-
Add or remove organization access for user records by selecting the check box for an organization record; or enable the Select All check box to select all the organizations in the list.
-
Click Add Organization Access (plus icon) for adding organization access.
-
Click Delete Organization Access (X icon) for removing organization access.
-
Configuration
The Configuration page enables you to set default values and configure how In-Memory Cost Management Cloud Service processes data.

The following parameters are listed and configured on this page:
Smart View Cell Formatting
Oracle Smart View for Office provides a common Microsoft Office interface for In-Memory Cost Management Cloud Service data sources. The Smart View interface enables you to view, import, manipulate, distribute, and share data sources in Microsoft Excel. The Smart View ribbon contains commands for operations and reporting.
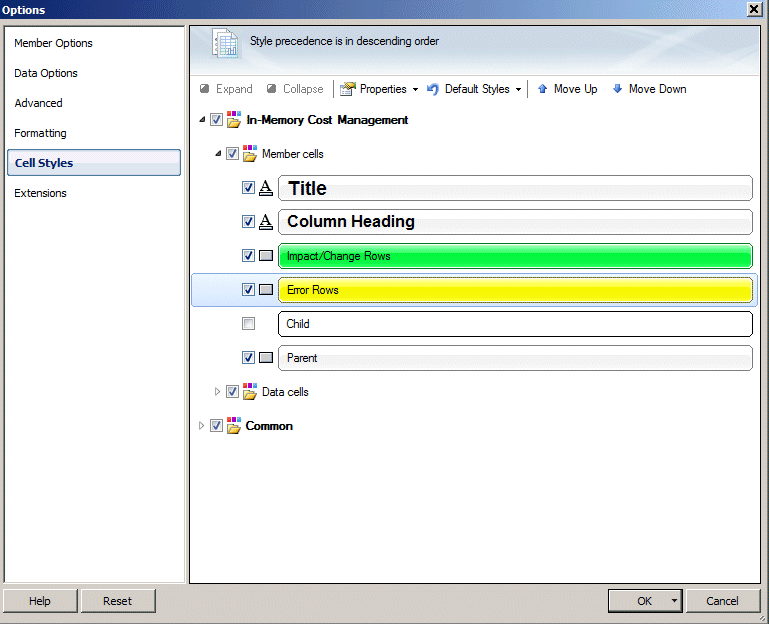
For improved readability, you can set spreadsheet cell style color and text options appearing in all the workbooks and worksheets you create. On the Cell Styles page, specify the formatting to indicate certain types of member and data cells. Because cells may belong to more than one type - a member cell can be both parent and child, for example, you can also set the order of precedence for how cell styles are applied.
To specify a cell background colors and font styles
-
Navigate to either the Cost Impact Simulation or Cost Comparison worksheets.
-
Select the Smart View ribbon.
-
Select the Options icon.
-
When the Options window appears, select the Cell Styles option.
-
Select Member cells and expand the drop-down menu. The following cell types appear:
-
Title
-
Column Heading
-
Impact /Change Rows
-
Error Rows
-
Child
-
Parent
-
-
Select the check box next to the cell type, and double-click the cell type to change the option.
-
For Title and Column Heading cells, the Font dialog box appears. You can change the font type, size, style, and color.
-
For Impact/Change Rows, Error Rows, Child, and Parent cells - the Color dialog box appears to change the cell background color.
-
-
After entering individual cell changes, choose OK to save your work and return to the Options window.
-
Save formatting options by choosing:
-
OK to save formatting options for your current session only.
-
The drop-down arrow on the OK button and select Save as Default Settings to set your selections as default settings.
-
Related Topics
Formatting Options, Oracle Smart View for Office User's Guide
Using the Member Selector
The Oracle Smart View interface provides the ability to search for values based on context in the Cost Impact Simulation and Cost Comparison worksheets. The Member Selection dialog box enables you to search for and select values to display on these worksheets. Available values, or members, appear in a tree.
To select multiple values on the spreadsheet
-
Navigate to an In-Memory Cost Management Smart View worksheet such as Cost Simulation or Cost Comparison.
-
Place your cursor in the column for the associated value you want to search.
-
Select Member Selection in the In-Memory Cost Management ribbon on the worksheet.
The Member Selection dialog box appears.

-
In the drop-down menu, select the column type value you are searching.
The available values appear in a tree list.
-
Click the Dimension Selector button to change the dimension. For example, if you are searching Entity Type, you can click the Dimension Selector to view other values such as Organization, Cost Type, and so forth.
-
Enable the check boxes next to the values you want to enter on the worksheet.
-
Select the Right-Arrow tool to move values to the Selection pane.
-
Select OK to move those selections to the worksheet.
Connecting to Data Sources
The Cost Impact Simulation and Cost Comparison pages use Oracle Smart View for Office with Microsoft Excel for investigating costing data in your organization. You can connect directly to active connections using a configured URL. You may need to access other connections through the Connections and Panel icons in the Smart View ribbon.
To navigate to data source connections
-
Navigate to the Cost Impact Simulation or Cost Comparison page.
-
Select the Smart View tab.
-
Select the Connections or Panel icon.
-
Select one of the following choices:
-
Active Connections
-
Reset to Default Connection
-
Reporting and Analysis Document
-
Recently Used
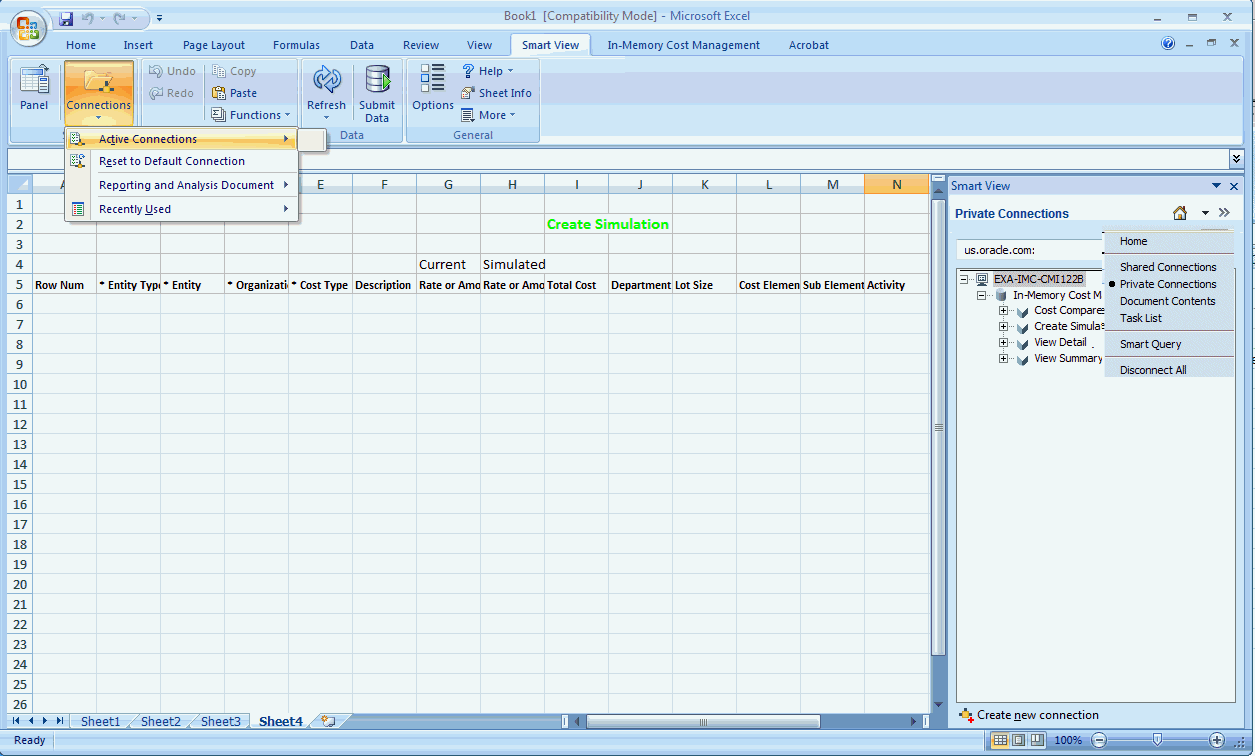
The Smart View panel appears on the side of the Excel spreadsheet. You can move, resize, or close the panel.
-
Background Processes
Background processes simultaneously execute programs running in the background for the eligible processes. The Background Process Scheduler parameter is used to set the polling frequency of the request manager interval. See: Configuration
To view background process statuses and perform tasks
-
Navigate to the Background Process region.
A listing of processing programs submitted appears on the page.
You have the option to search the list of processes using a quick or advanced query:
-
Quick Query enables searching when you know information such as part of a name or description.
-
Advanced search offers multiple search criteria and conditional qualifiers. This method is used when looking for specific values.

The information for each background process appears in the following fields:
-
Job ID number
-
Program name
-
Job Status
-
Submitted and Submitted By
-
Started and Completed dates
-
Completion Text
-
Schedule
-
-
Use the Completion Text field to view messages regarding the job status completion. The messages can include error messages if the background process fails.

-
Use the Schedule section to view When the process is scheduled and the Start date.
-
Click the View Parameters icon to see the Plan Code associated with this process.
-
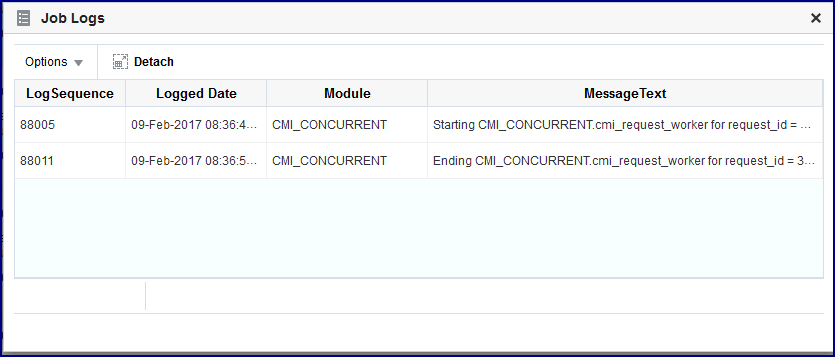
Click the View Logs icon to see the log data in the Job Logs dialog box including Sequence, Date, Module, and Message Text. You can export or print the log output by choosing the following in the Option drop down box:
-
Export to Excel
-
Printable Page
-
-
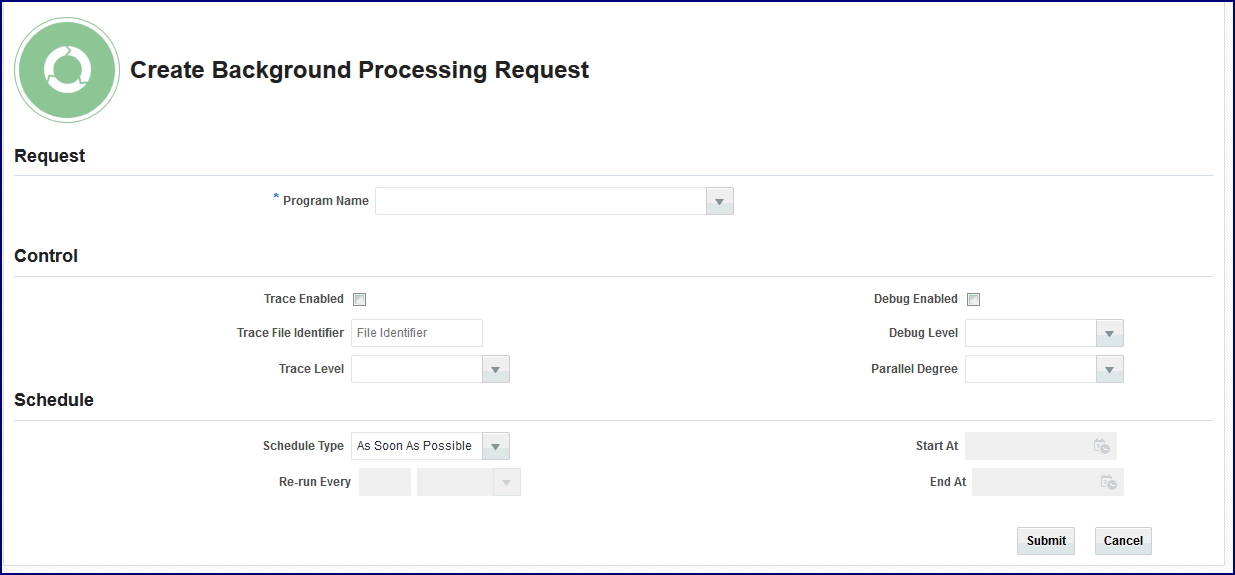
Select the New Job icon to navigate to the Create Background Processing Request page.
The page is divided into three sections: Request, Control, and Schedule.
-
In the Request section, enter the background process name in the Program Name field.
-
In the Control section, select information for diagnosing processing issues for the request including:
-
Trace Enabled
-
Trace File Identifier
-
Trace Level
-
Debug Enabled
-
Debug Level
-
Parallel Degree
-
-
In the Schedule section, select information regarding scheduling this process including:
-
Schedule Type
-
Re-run
-
Start and End At times
-
-
Choose Submit to schedule this request.
The following is a list of background processes in In-Memory Cost Management Cloud Service.
In-Memory Cost Management Cloud Service Background Processes Process Description Calculate Actual COGM (Discrete)
Calculate Actual COGM (Process)This process is related to the cost planning feature. Calculates the actual cost of goods manufactured for a given cost plan. The actual COGM can be used to compare with the plan COGM. Ensure accurate data, run this program after the plan months have passed, when the actual cost data is available. Calculate Gross Profit for Cost Impact Simulator (Discrete)
Calculate Gross Profit for Cost Impact Simulator (Process)Considers all the orders used in the simulation calculation and is a required background process for viewing the Gross Profit Analyzer dashboard. Create Cost Hierarchy (Process) Extracts detailed product cost structures for selected products from a simulation. This data can be leveraged by customers to prepare their own reports to analyze and compare costs. Create Product Category Hierarchy Creates the setup data used for the Gross Profit Analysis dashboard. This process creates the product category hierarchy for the product dimension in the profitability analysis. There are two methods for creating the hierarchy: -
Using the product catalog setup: If the product catalog category set is defined in the configuration, then the process uses product catalog category hierarchy to create the product dimension.
-
Using the segments of category:
-
If the product catalog category set is not defined in the configuration—the process uses the segments of the category for the products attached to the costing functional area, and creates the hierarchy.
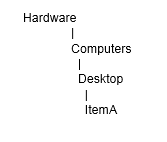
For example if the category attached to a product is ItemA and costing functional area is Hardware.Computers.Desktop—it will create the product dimension with the following hierarchy:
-
Run this process after product installation. After new categories are created, categories are changed, or the category assignment of items is changed.Create Territory Hierarchy Creates the setup data to be used for the Gross Profit Analysis dashboard. This process creates the hierarchy of territories which is used to show the corresponding region hierarchy for customer dimension in the profitability analysis.
Run this process after product installation and after territories are created or changed in the source system.Create Time Dimension Creates the setup data for the Gross Profit Analysis dashboard. It uses general ledger periods and creates the time dimension required for reporting in Profit Analysis.
Run this process after product installation, each time new periods are opened, and when the calendar is changed.Generate Key-Flexfield Views Creates descriptive flexfields as defined in the on premise version of In-Memory Cost Management which provide customizable segments to track additional and unique information to your business. IMCM Full Process Cost Rollup For a future release. Import Price Lists Imports price lists from a particular source into In-Memory Cost Management Cloud Service. Import Supply/ Demand for Cost Planning (Discrete)
Import Supply/ Demand for Cost Planning (Process)This process is related to the cost planning feature. It imports the supply and demand that a cost plan uses to calculate driver values and unit costs.
Load the Supply Demand plans into the interface table using the REST webservice before running the program.In-Memory Cost Planning Engine (Discrete)
In-Memory Cost Planning Engine (Process)Executes cost plans and performs the driver value calculation, allocated amount calculation, and unit cost calculation for each plan month. Incremental Margin Load background processes: -
Incremental Margin Load (Discrete)
-
Incremental Margin Load (Process)
-
Incremental Margin Load for Planned Orders (Discrete)
-
Incremental Margin Load for Planned Orders (Process)
These processes collect the data for actual costs; and incrementally load data from Accounts Receivables, Accounts Payables, Inventory, Order Management, Sales forecasting, and Cost Management. This process gathers the actual COGS and invoiced information for shipped and invoiced sales orders. It also gathers data for sales orders that are open and booked—but not yet shipped or invoiced and sales forecasts. See: Incremental Margin Load Programs Margin Load for Cost Plans (Discrete)
Margin Load for Cost Plans (Process)This process is related to the cost planning feature. Use this process to perform the margin load and calculate the profitability impact using the plan costs. Purge Cost Plan (Discrete)
Purge Cost Plan (Process)This process is related to the cost planning feature. Deletes cost plan records from your system. Purge Simulation (Discrete)
Purge Simulation (Process)Enables you to remove and delete cost simulation records from your system. Purge Margin Data Purges collected COGS and revenue data in the fact tables and dimensions. -
Fact tables contain various measures, attributes of measures, and foreign keys that connect the fact table and the dimension tables.
-
Dimensions contain attributes for items such as time, organization, and customer.
This data is collected by the Gross Profit Analyzer to calculate the margins that are displayed in the multiple dashboards.Purge Simulation Margin Load Deletes simulation margin load records from your system. Simulation Margin Load (Discrete)
Simulation Margin Load (Process)Launches simulations to show the impact of product cost variations. Uses the actual cost information to create the simulated comparison data. The calculation is used in the Gross Profit Analysis and Impact on Gross Profit dashboards.
See: Simulation Margin Load ProgramsValidate Cost Planning Scopes (Discrete)
Validate Cost Planning Scopes (Process)This process is related to the cost planning feature. Validates the allocation scopes and identifies any invalid scope settings. Incremental Margin Load Programs
These background processes collect the data for actual costs; and incrementally load data from Accounts Receivables, Accounts Payables, Inventory, Order Management, and Cost Management—to gather the actual COGS and invoiced information for shipped and invoiced sales orders. They also gather data for sales orders that are open and booked—but not yet shipped or invoiced, data for newly created items and customers.
The processes must be run to use the following functions:
-
Simulation Margin Load
-
Calculate Gross Profits in the Cost Impact Simulation page
At completion, the processes launch the Incremental Margin Load for Planned Orders program to import the data for planned orders.
Chronological considerations for profit analysis display are:
-
Set the Profitability parameters on the Configuration page to configure default values used for the margin load programs:
-
Margin Load Parallel Degree specifies the parallel degree when the Incremental Margin Load is run.
-
Margin Load Start Date: Date used for the Margin Load for Cost Plans background process when loading the data for the first time.
-
-
Invoice Quantity and Invoice Amount values are populated after the Invoice Import and Revenue Recognition programs in Accounts Receivables are run.
-
Launch these programs prior to launching the Incremental Margin Load program. Otherwise, COGS and Shipped Quantity values display as Null on the Profit Analysis dashboards.
-
After running the Interface Trip Stop-SRS process in Shipping Execution, ensure that the Workflow Background Process is successfully completed prior to launching the Incremental Margin Load concurrent program.
-
Schedule the processes to run on a periodic basis to have the information needed for accurate simulations.
Simulation Margin Load Programs
The Simulation Margin Load process uses the actual cost information to create the simulated comparison data. The calculation is used in the Gross Profit Analysis and Impact on Gross Profit dashboards. After entering the Cost Type:
-
The program calculates the simulated COGS and simulated margins based on the costs defined in that cost type.
-
If the costs do not exist in the cost type specified, then the program attempts to get the cost from the default cost type specified.
-
If the default value does not exist, then the simulated COGS is defaulted as actual COGS.
-
Use the Configuration page to set the Profitability parameter to configure the default value used for simulations: Simulation Margin Duration (months): The number of months to be used in the Simulated Margin Load process.
-
Related Topics