Individual Email Performance dashboard
The Individual Email Performance dashboard provides a detailed view of an email's performance. The dashboard contains three tabs:
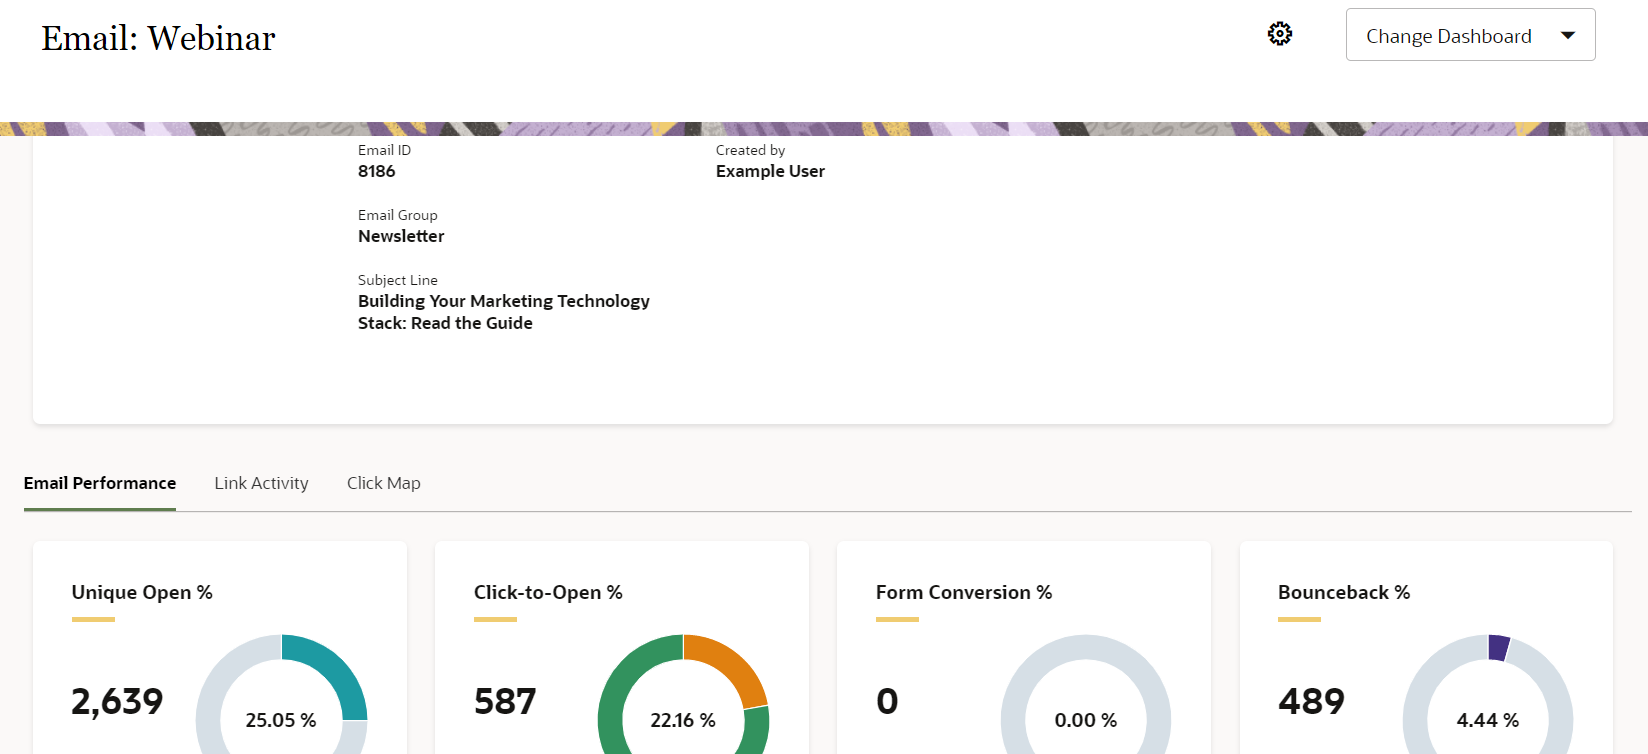
- Email Performance: Shows the unique open rate, click-to-open rate, form conversion rate, and bounceback rate. You can view the performance by segment or on a timeline. This dashboard summarizes the email's performance across all campaigns.
- Link Activity: Shows total click visuals.
- Click Map: Shows a visual representation of how users interact with tracked links in your emails.
Click a link below to find out more about this dashboard:
Good to know
- Unless otherwise noted below, forwarded messages count toward the metrics in this dashboard. For example, if a contact forwarded an email, and the recipient clicked a link, the recipient's clickthrough would count towards the clickthrough metrics in this dashboard.
- The Link Activity tab reports can be viewed in Insight. To access a dashboard report in Insight, click
 . The reports are available in Insight in the following location: Shared Folders / Dashboard Reports / Individual Email Performance. If you have implemented Contact Security, you will only see the contact details for those contacts that you have permission to access.
Dashboard metrics
The Email Performance tab captures the following metrics:
| Metric | Description |
|---|---|
| Sends | The total emails sent. |
| Bounceback Rate | The total bouncebacks (hard and soft) divided by the total emails sent. (Total Bouncebacks / Total Sends) |
| Opens |
The total opens by email recipients (original recipients or email forwards). An open is counted every time the email is opened. |
| Clickthroughs | The total clickthroughs. This includes multiple clicks by the same recipient. System Action links are not tracked. |
| Unique Open Rate |
The unique opens divided by the total number of times an email was delivered. (Unique Opens / Total Delivered) A unique open is the number of recipients (original recipients or email forwards) that opened an email at least once. This does not count all the times that the same recipient opened the email. |
| Click-to-Open Rate | The unique clickthroughs by the original recipient divided by the unique opens by the original recipient. This metric calculation ignores possible forwards. (Clicked Sends / Opened Sends)
Clicked sends: The first clickthrough by the original recipient. This metric ignores possible forwards. Opened sends: The number of first opens for the emails that were sent. This metric ignores possible forwards. |
| Form Submissions | The total form submissions that can be attributed back to the email sent. |
| Form Conversion Rate | The total form submissions that can be attributed back to the email sent divided by the total emails delivered. (Total Form Submissions from Email / Total Delivered) |
The Link Activity tab captures the following metrics:
| Metric | Description |
|---|---|
| Total Clicks | The total clickthroughs. This includes multiple clicks by the same recipient. System Action links are not tracked. |
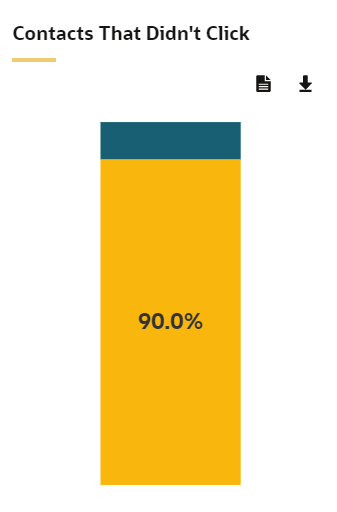
| Contacts That Didn't Click | The percentage of contacts who received the email and did not click. (Total Sends - Clicked Sends) / Total Sends |
Understanding the charts on the dashboard
The dashboard contains three tabs of information about your email: Email Performance, Link Activity, and Click Map.
Email Performance
Email Summary
The first chart summarizes the email's performance across all campaigns. Beside each pie chart, you'll see the a total number, and inside the pie chart you'll see the rate. For example, the total number of unique opens beside a pie chart could display 2,639, and the unique open rate of 25.05% would be displayed inside the chart.
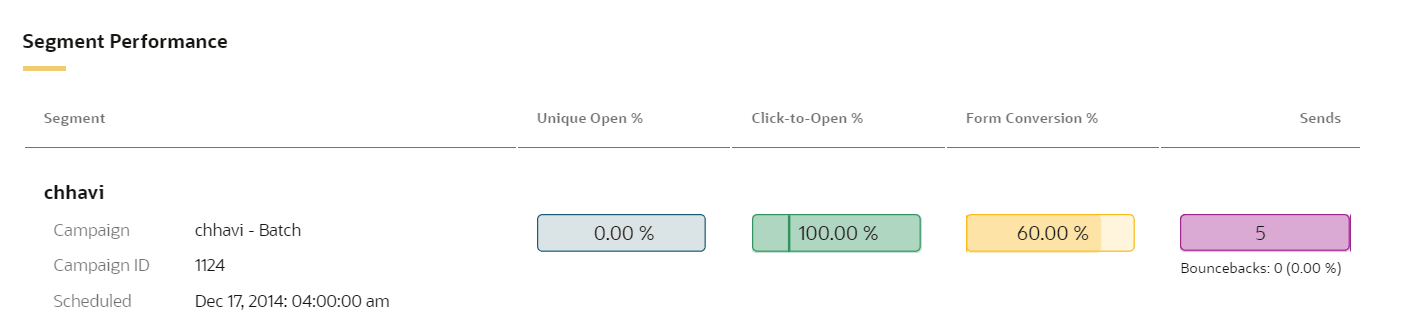
Segment Performance
This chart displays key performance metrics for the email by each segment. For comparison, the darker vertical bars in each graph represent the lifetime average for this email.
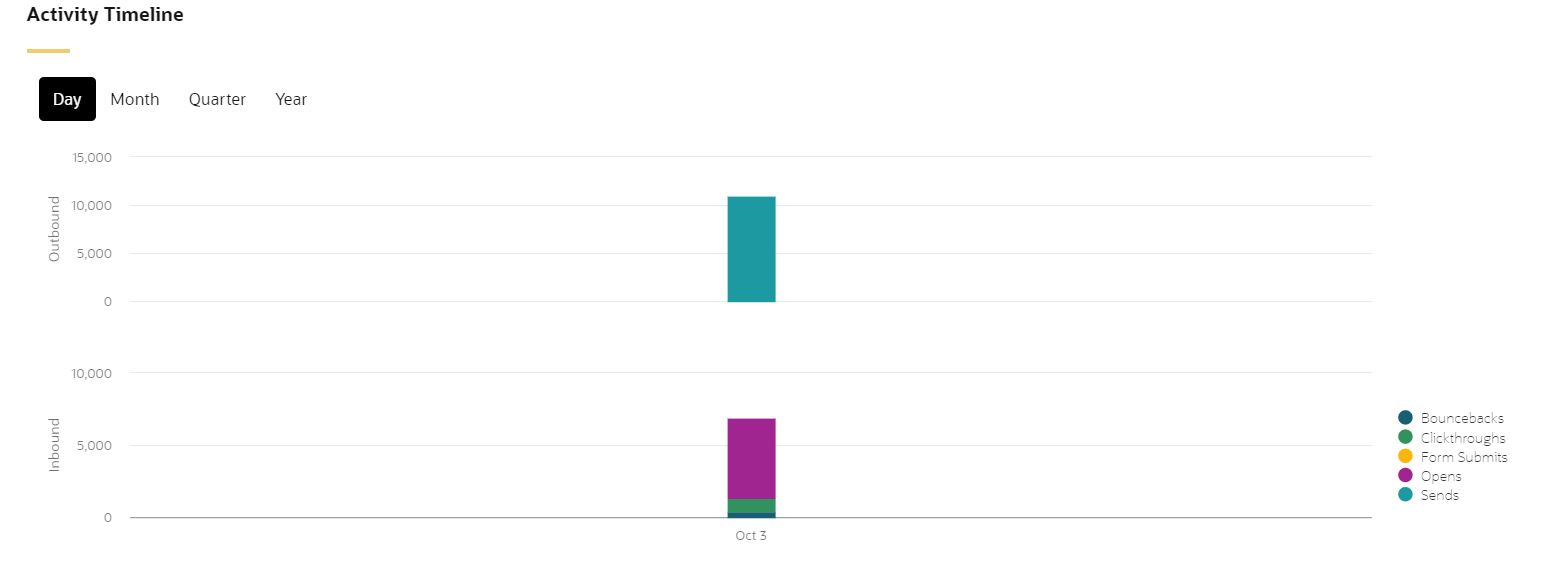
Activity Timeline
This chart shows the outbound (emails sent) and inbound activity. You can use the buttons at the top of the chart to filter by day, month, quarter, or year. You can use the legend to filter by specific activity types.
Link Activity
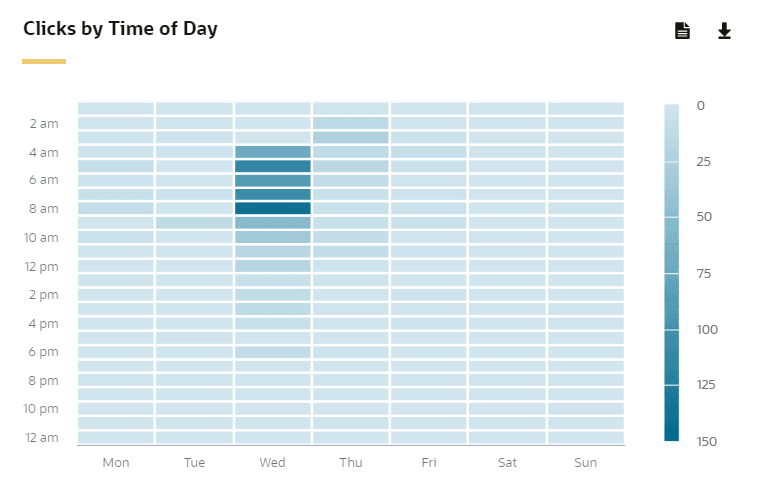
Clicks by Time of Day
This heat map chart shows the total clicks by the day of the week and time of day. To view break down of total clicks by segment, load the Insight report.
Contacts That Didn't Click
This chart shows the percentage of the contacts who received the email and did not click. We calculate this using the following formula: (Total Sends - Clicked Sends) / Total Sends. Clicked Sends is the first clickthrough by the original email recipient. This metric ignores possible forwards.
To view those contacts that didn't click and whether they opened the email, access the report in Insight.
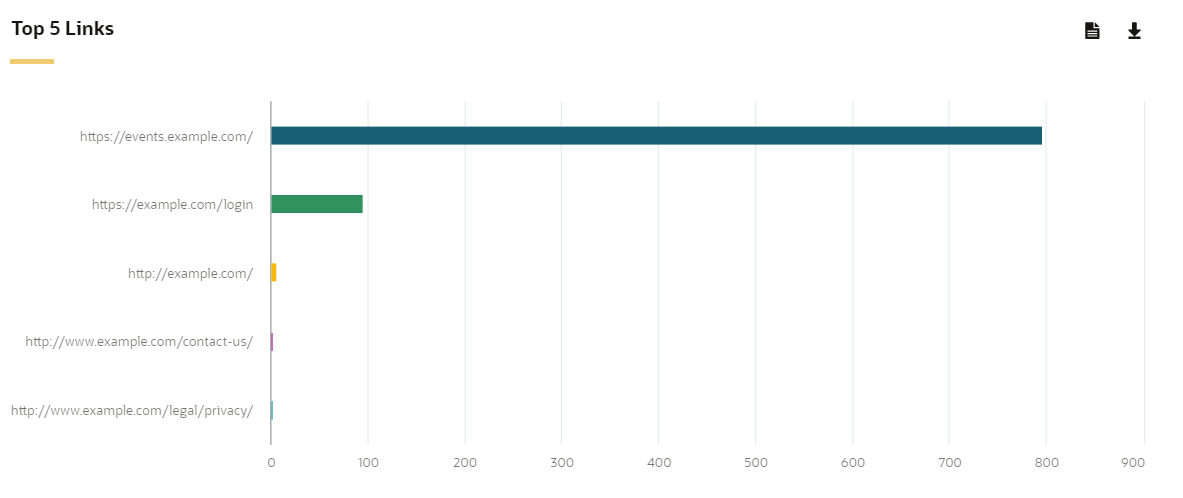
Top 5 Links
A chart showing the top five links in your email by total clicks. To view a breakdown of the total clicks by segment, load the Insight report.
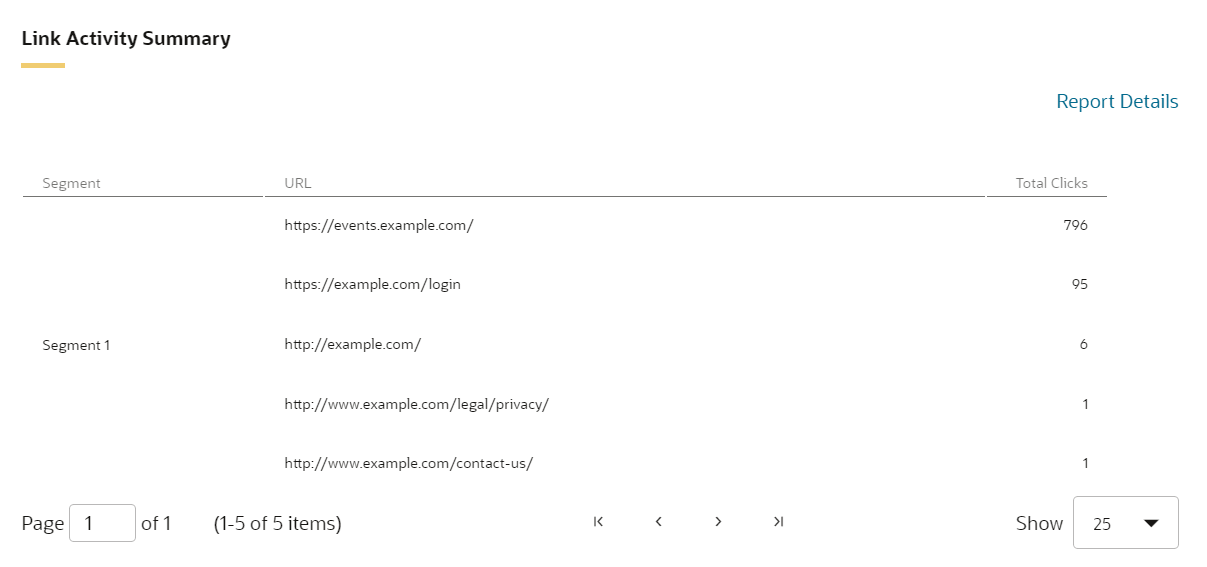
Link Activity Summary
A tabular breakdown showing total clicks by link. To view the contact details associated with the clicks, load the Insight report.
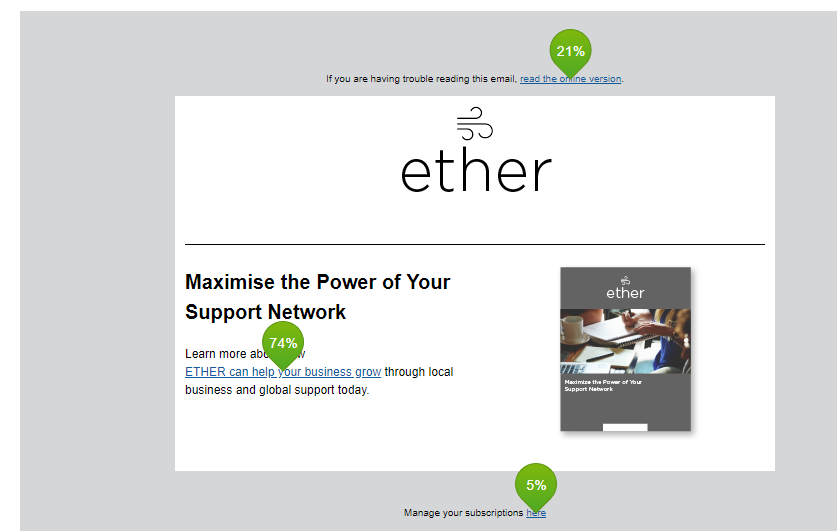
Click Map
The Click Map gives you a visual representation of where contacts click links in your email. Link performance is based on the total clicks that the link received.
Tip: Avoid copying and pasting links in an email. This results in links with duplicate IDs and makes it impossible to tell which copy of the link a contact clicked. The Click Map displays all the link activity for copied links in one instance of the link. Other instances of the link appear with an X.
Note that total clicks in the Click Map can be different to an Insight report because of the following:
- The Click Map includes clicks from test emails whereas Insight excludes them.
- The Click Map shows near real-time click data whereas Insight refreshes click data hourly.
- The Click Map shows the current version of the email with default dynamic content. If you changed the email over its lifetime or have different versions due to dynamic content, use Insight to view all email links.