Email Analysis dashboard
The Email Analysis dashboard provides a comprehensive overview of the performance of emails sent within the specified time frame. The dashboard uses metrics such as email opens, clickthroughs, form submissions, and more so that you can easily compare the performance of your emails.
By default, the dashboard shows information for emails sent within the last two weeks and groups information on the dashboard by email groups.
Click a link below to find out more about this dashboard:
Good to know
- When you view this dashboard, you specify the time frame based on when the email was sent. The performance metrics included in the dashboard are not limited to the same time frame. The metrics reflect the activity that happened because of an email being sent. For example, you want to chart on the performance of emails sent last month. If a contact opened the email yesterday and followed a link, the dashboard for last month includes the contact's activity from yesterday.
- Unless otherwise noted below, forwarded messages count toward the metrics in this dashboard. For example, if a contact forwarded an email, and the recipient clicked a link, the recipient's clickthrough would count towards the clickthrough metrics in this dashboard.
- To access a dashboard report in Insight, click
 . These dashboard reports are available in Insight in the following location: Shared Folders / Dashboard Reports / Email Analysis Overview.
Dashboard filters
Use the Filter results section of the dashboard to change the time frame and email groups shown on the dashboard.
- Date Range: The time frame the emails were sent.
- Email Groups: The email group that the email is associated to.
Dashboard metrics
This dashboard captures the following metrics.
| Metric | Description |
|---|---|
| Total Sends | The total emails sent. |
| Bounceback Rate | The total bouncebacks (hard and soft) divided by the total emails sent. (Total Bouncebacks / Total Sends) |
| Clickthroughs | The total clickthroughs. This includes multiple clicks by the same recipient. System Action links are not tracked. |
| Clickthrough Rate | The total clickthroughs divided by the total number of times an email was delivered. (Total Clickthroughs / Total Delivered) |
| Open Rate | The total opens divided by the total number of times an email was delivered. (Total Opens / Total Delivered) |
| Unique Open Rate | The unique opens divided by the total number of times an email was delivered. (Unique Opens / Total Delivered) A unique open is the number of recipients (original recipients or email forwards) that opened an email at least once. This does not count all the times that the same recipient opened the email. Oracle Eloqua counts an email as opened if the recipient loaded the tracking pixel image contained in the email or clicked a link in the email. Learn more about |
| Click-to-Open Rate | The unique clickthroughs by the original recipient divided by the unique opens by the original recipient. This metric calculation ignores possible forwards. (Clicked Sends / Opened Sends)
Clicked sends: The first clickthrough by the original recipient. This metric ignores possible forwards. Opened sends: The number of first opens for the emails that were sent. This metric ignores possible forwards. |
| Form Submissions | The total form submissions that can be attributed back to the email sent. |
| Form Conversion Rate | The total form submissions that can be attributed back to the email sent divided by the total emails delivered. (Total Form Submissions from Email / Total Delivered) |
Understanding the charts on the dashboard
Email Sends by Email Group
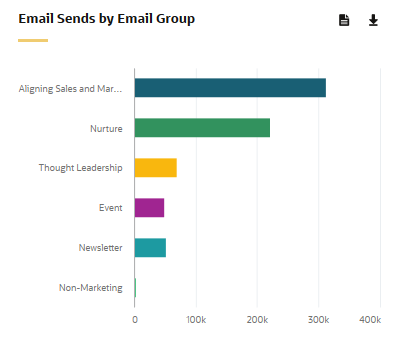
This chart measures the number of emails sent within the time frame specified. Emails sends are categorized by email group.
Overall Performance by Email
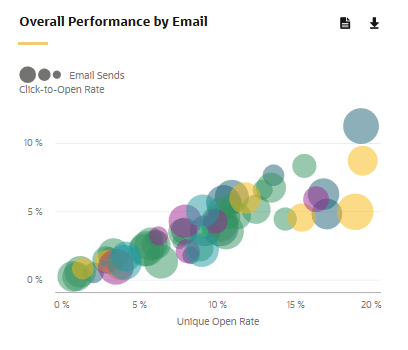
This chart compares the relative performance of the emails in a group according to the click-to-open rate (vertical axis) and unique open rate (horizontal axis). Each bubble represents an individual email asset and the size is proportional to the number of emails sent.
Send Time Optimization Performance
Important: Effective June 12, 2025, Oracle Eloqua's Advanced Intelligence (AI) features are available for all customers. To enable Eloqua's classic and Generative AI (Gen AI) functionality, open a service request with Oracle Support. Please review our product notice for more information.
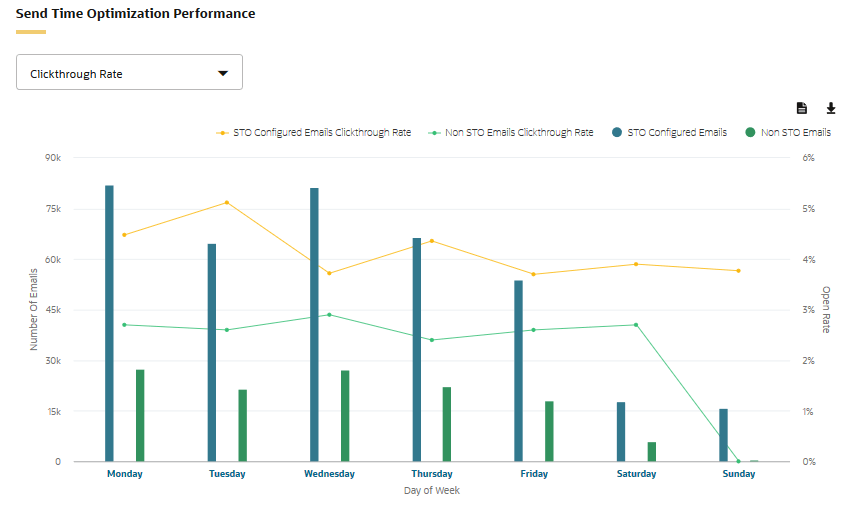
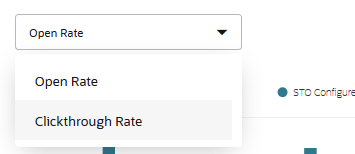
This chart provides a comparison of your emails sent with Send Time Optimization and those sent without, using total email sends, email open rate, and clickthrough rate. Use the drop-down to switch between viewing open rate and clickthrough rate.
You can use this chart to compare email types (emails sent with Send Time Optimization and those without) as well as differences between total sends and open rates for different days of the week. Clicking on a day of the week drills down to the performance by hour. Click the page icon in the top right to access the Send Time Optimization Performance by Day of Week report and the Send Time Optimization Performance by Day and Hour report in Insight.
Email Activity Timeline
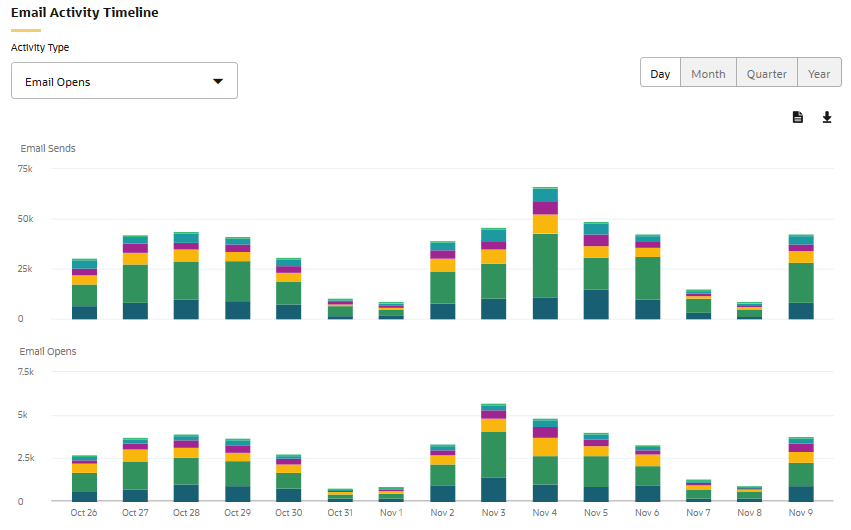
This chart shows all email activity that occurred after the email was sent. You can use the drop-down list at the top of the chart to filter by activity type (email opens, email clickthroughs, or form submissions).
Since the chart reflects all email activity regardless of the time frame you specified for the dashboard, you can use the buttons at the top of the chart to view the daily, monthly, quarterly, or yearly activity.
Email Activity Summary
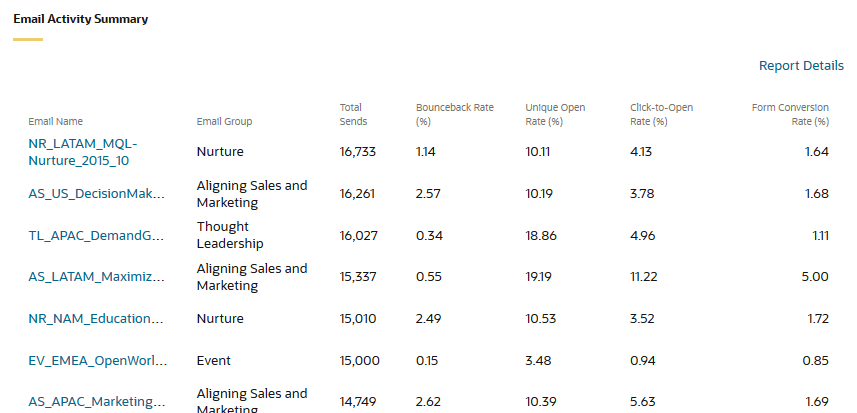
This chart lists more details about individual emails included on the dashboard such as bounceback rate, unique open rate, click-to-open rate, and form conversion rate. You can click an email name to view a detailed dashboard for that email. For more information about what is displayed, see Individual Email Performance dashboard. Click Report Details to navigate to the Email Activity Summary report in Insight.
Email open by device metrics dashboard