The Scheduling Service Home Page
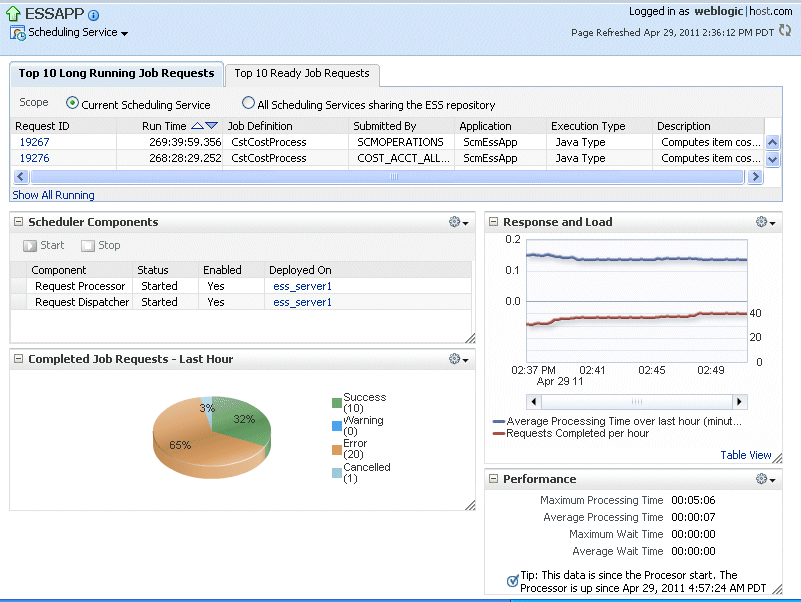
The Scheduling Service home page provides an overview of the performance of Oracle Enterprise Scheduler components and jobs, including component status, the number of completed job requests in the last hour, as well as the processing times for running jobs.
You can use this page as a starting point for monitoring and administering Oracle Enterprise Scheduler. Figure 2-1 shows a portion of the Scheduling Service home page.
These pages contain the following regions:
-
Top Ten Long Running Requests and Top Ten Ready Job Requests Regions
The Top Ten Long Running Requests region displays the top ten long running scheduled job requests, including request ID, job runtime, job definition used, executing application, job execution type and description. You can set the scope of the top ten long running requests displayed to the current scheduling service only, or all scheduling services sharing the Oracle Enterprise Scheduler repository. For more information, see "Viewing Top Ten Long Running Oracle Enterprise Scheduling Service Requests" in Monitoring Oracle Enterprise Scheduler.
-
Scheduler Components Region
The Scheduler Components region displays the components of Oracle Enterprise Scheduler, including the job request processor and dispatcher. The tab displays the status of each component, the name of the server to which it is deployed and whether or not the component is enabled. You can start and stop each component as required. For more information, see "Viewing Scheduler Component Status" in Monitoring Oracle Enterprise Scheduler.
-
Completed Job Requests Region
The Completed Job Requests region displays the status of scheduled jobs completed within the last hour. For more information, see "Viewing Completed Job Requests" in Monitoring Oracle Enterprise Scheduler.
-
Response and Load Region
The Response and Load region displays performance monitoring statistics regarding the time required to process job requests. For more information, see "Viewing Job Request and Load" in Monitoring Oracle Enterprise Scheduler.
-
Performance Region
The Performance region displays performance data for job requests, such as processing times and wait times. For more information, see "Viewing Performance as Processing and Wait Times" in Monitoring Oracle Enterprise Scheduler.
-
Monitoring and Diagnostics Region (Cloud Control only)
The Monitoring and Diagnostics sub-section displays major incidents and changes that have occurred in the instance, including incidents at the instance level, incidents that have occurred in descendant targets, any configuration changes that have occurred over the last seven days and any support workbench problems. Incidents are listed by severity, namely fatal, critical, warning and escalation levels.
