View Moving Averages in Time Series
You can add a moving average to a time series chart to show the average change in the data over time. Users can choose the period over which the moving average is calculated.
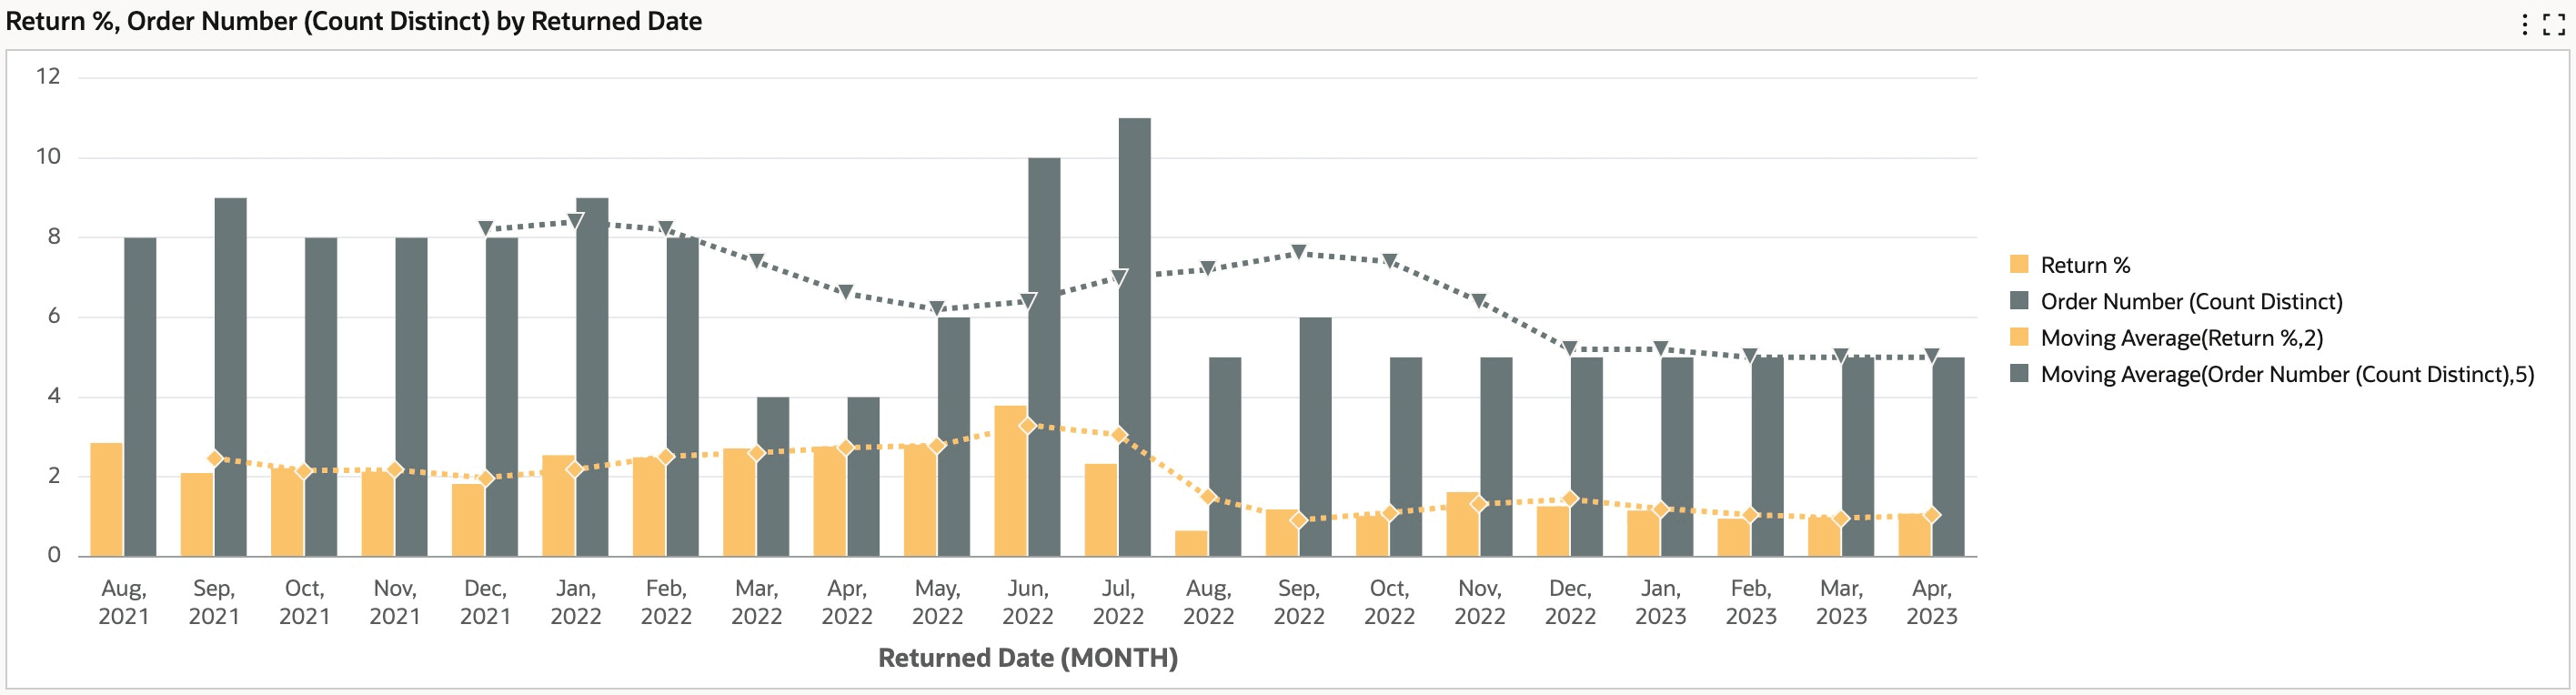
Example of a Simple Moving Average in a Chart
Steps to enable and configure
You don't need to do anything to enable this feature.
Key resources
- "Simple Moving Average" in Dashboard Components, Oracle E-Business Suite User's Guide
- "Simple Moving Average" in Examples of Configurations for Analytical Functions in Charts, Oracle E-Business Suite Extending Enterprise Command Centers