Generating the Stage Balancing Report

After calculating the model, use the Standard Stage Balancing Report to validate the results by balancing assigned and input values to account for any unassigned costs.

Separate reports must be generated for cost and revenue data.

Note:

In order to generate the Stage Balancing report, the database must be deployed, data should be loaded, and then the database must be calculated.

The outline structure provides the following information for each stage:

  • Inputs - summation of the values associated with the input balancing measure

  • Total Output is the sum of all output measure values on the Destination stage. This value is associated with the Received balancing measure

  • Amount output to each downstream stage

  • Total output to downstream stages

  • Total unassigned cost or revenue

  • Total idle cost or revenue

  • Over Driven costs or revenues

Depending on the contents of the model, some or all of these types of data are available in each model stage:

Table A-11 Sources of Data for Stage Balancing Reports

Measure or Formula Oracle Essbase Measure Name Source of Data
Direct Input (User-entered cost and revenue)
  • CostInput

  • RevenueInput

Essbase
Assg Input (Assigned Input)
  • CostReceivedPriorStage

  • RevenueReceivedPriorStage

Essbase
Total Input =Direct Input + Assigned Input Calculated
Cost Assigned CostAssignedPostStage

NetCostForAssignment

Essbase
Numbers representing each stage CostReceivedPriorStage or CostAssignedPostStage

These numbers represent cost that is assigned from previous stages to the selected one. The calculated numbers can be compared to numbers in "Assg Input" to check for inconsistencies in Essbase.

Essbase
Total Out SUM for all stages in current row Calculated
Idle
  • IdleCost

  • IdleRevenue

Essbase
Over Driven
  • OverDrivenCost

  • OverDrivenRevenue

Essbase
Unassigned (in Essbase)
  • UnassignedCost

  • UnassignedRevenue

Essbase
Unassigned (in Essbase) = "Total IN" - "Total OUT" - "Idle" Calculated

The calculated values can be compared against data from Essbase.

To print the report, select File, and then Print from the browser menu.

To generate stage balancing reports:
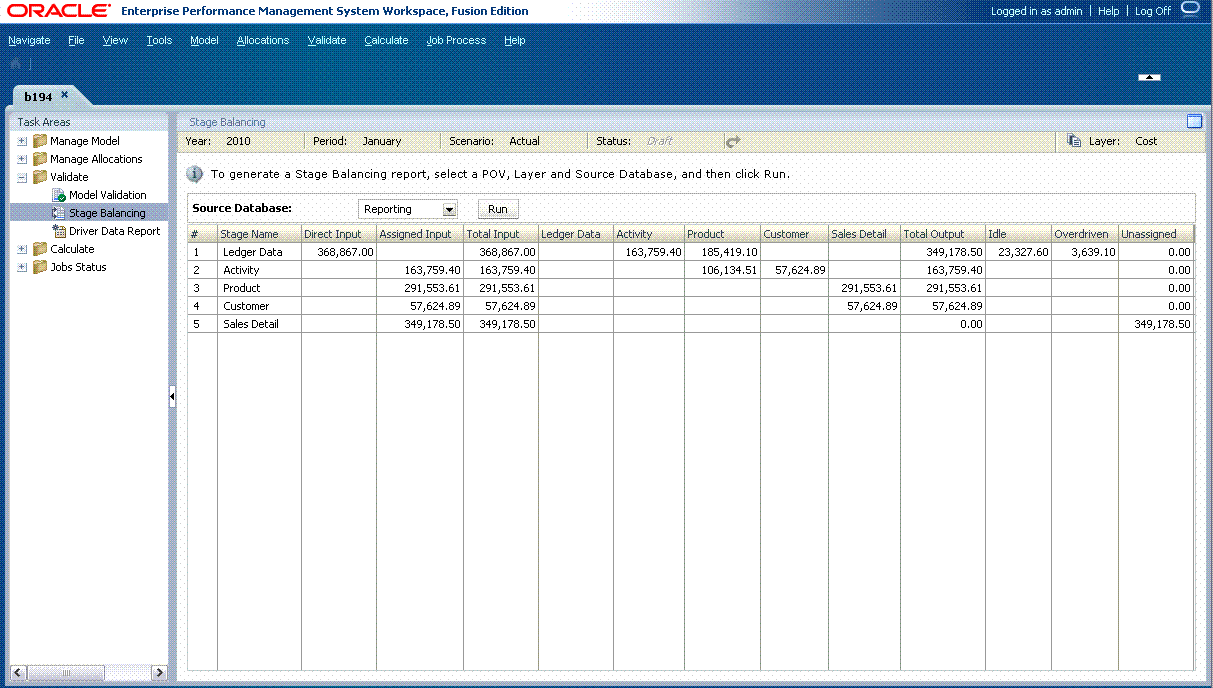
  1. Before generating the report, ensure these applications and services are running:
    • Oracle Hyperion Provider Services

    • Oracle Hyperion Shared Services

    • Essbase

    Note:

    In order to generate the Stage Balancing report, the database must be deployed, data should be loaded, and then the database must be calculated.

  2. Optional: If you want to display the Stage Balancing Report using the calculation database, run a default Calc All on the Calculation (BSO) database before generating the report.
  3. In an open model, from Task Areas, select Validate, then Stage Balancing.

    The Stage Balancing screen is displayed.

  4. Select the POV for the model, and then click Go Go icon.
  5. From Layer, select the cost or revenue layer for the selected model.
  6. From Source database, select the type of report to be generated:
    • Reporting (ASO database results) — Recommended

    • Calculation (BSO database results) — Before using the Calculation database (BSO) to generate the Stage Balancing Report, all calculations and default calculations must be executed and complete.

  7. Click Run.

    The report is generated.


    The Stage Balancing screen is used to select and generate stage values for Direct Input, Assigned Input, business dimensions, Total Output, and Idle, Overdriven and Unassigned, if available.
  8. Review the report, using one or more of these validations to verify the results:
    • Total Input – Total Output — Idle = Unassigned Values

    • Sum of all allocations to the stage = Assigned Input

    • Sum of unassigned values + Idle = Direct Input

    • You can also launch some predefined Smart View integrations from the Stage Balancing screen. The launch data points are represented as hyperlinks in the Stage Balancing screen and present values that have been contributed from one stage to another. You can drill down further on input or allocation data. For example, you could drill-down into Unassigned costs after an allocation run, or to examine input data that was used in the same run.