Tracing Allocation Detail

Allocation Detail enables you to follow allocations, step-by-step, directly from a source intersection to its ultimate destination, or from a destination intersection to its source. The intersections that contribute to, or receive value from, the starting point show the stage and associated members.
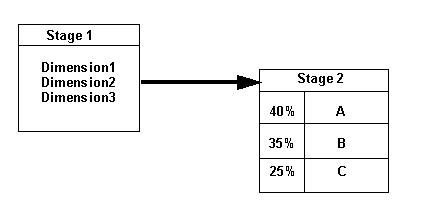

The diagram follows the direct flow of allocations, from one stage to another.

Direct allocation data is used to calculate the percentage for each step along the flow using the following formulas:

  • For drilling forward:

    % = ASSG CostReceivedPrior(orIntra)Stage / SRC NetCostForAssignment

  • For drilling backwards:

    % = ASSG CostReceivedPrior(orIntra)Stage / DEST NetCostForAssignment

For each stage, the percentage of each allocation contributing to the next intersection is displayed, from highest to lowest. The percentages displayed for a stage will not equal 100% if the following conditions exist:

  • If there are idle costs on an intersection.

  • If there is cost input at a destination when drilling upstream (back to the source).

To trace allocation detail:

  1. Ensure all allocation scripts have been run.
  2. In an open model, from Task Areas, select Manage Allocations, then Trace Allocations.

    The Traceability screen is displayed.

  3. Select a POV, and then click Go Go icon.
  4. Select a Layer.
  5. Under Starting Point, select Prefs to choose the preferences for the information to be traced:
    • Select the type of trace to be performed:

      • Allocation Detail to follow allocations, step-by-step, directly from a source intersection to its ultimate destination

      • Allocation Flow to display the source and destination intersections that have an indirect relationship, rather than a direct assignment, to the selected intersection.

    • Select a display mode for the map:

      • Display Alias

      • Display Name

        Note:

        If Display Alias is selected, and no alias is set, the Display Name is shown in square brackets ([ ]).

  6. For each dimension, click Selector Selector Button, and select the member to specify the intersection from which you want to begin tracing.

    Note:

    You must select the lowest level member in order to display the allocation.

  7. Select Allocation Detail.
  8. Click Trace Trace Button to begin mapping the financial flow.

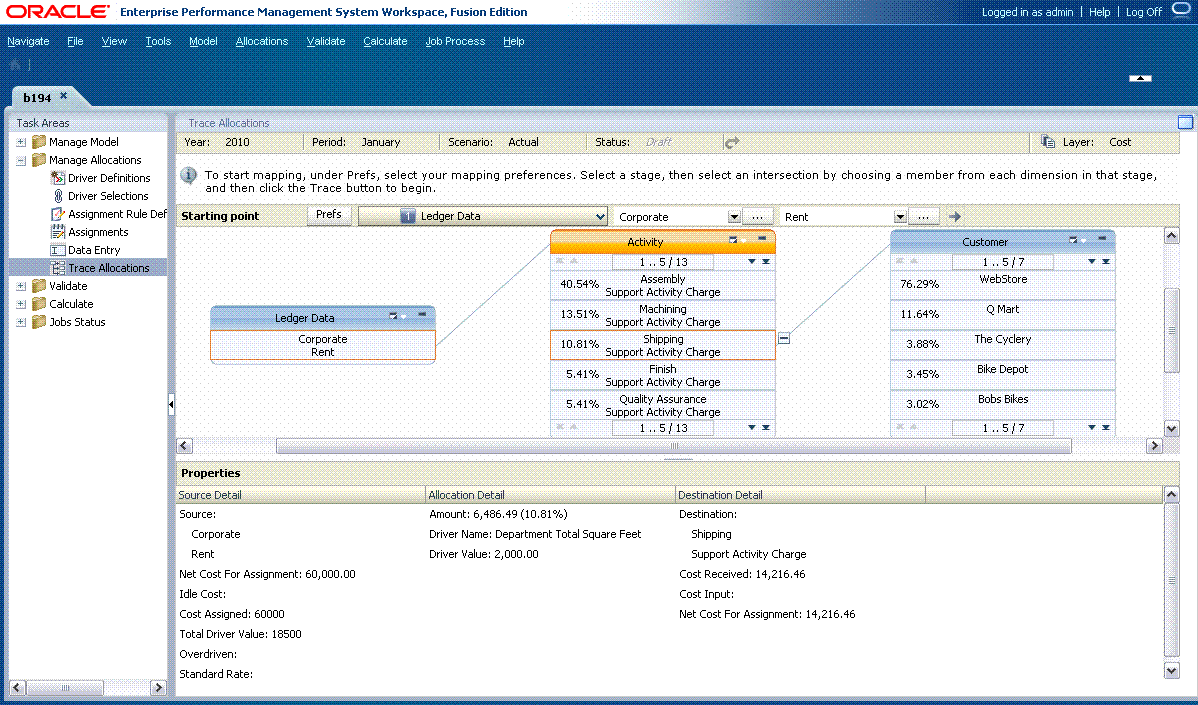
    The selected intersection is displayed on the screen, showing the name of the stage, and the members selected for each dimension in the intersection. The Properties for the starting point of the selected intersection are displayed at the bottom of the screen.


    The selected intersection is displayed, and you can expand the plus icon on either side of the icon to follow the flow of allocations forward or backward in the model.

    Note:

    You can drag the entire flow diagram to position it for a more effective view. Depending on the number of dimensions in the model stage, you may need to stretch or scroll the window to see the Trace button on the far right side of the task bar.

  9. Optional: On the intersection header, select the Trace Allocation Context Menu Trace Allocation Context Menu, and then select the maximum number of nodes that you want to display when the selected intersection is expanded (3, 5, 10 or 20). You can repeat this selection on any intersection.
  10. Click the intersection to highlight the source node.

    Note:

    Expand node Plus Sign icon is only displayed on the intersection after it has been selected.

  11. Under Properties, review the Source Detail that pertains to the selected intersection.

    The following information is provided about the source:

    • Source lists all dimension members selected for the starting point.

    • Net Cost For Assignment

    • Idle Cost, if any.

    • Cost Assigned

    • Total Driver Value

    • OverDriven, if any

    • StandardCostRate, if any

  12. Select the next intersection to view, and click expand Plus Sign Icon to view the incoming or outgoing allocations for the selected intersection. You can navigate either upstream or downstream by expanding the nodes on either side of the intersection.

    The intersections that contribute to, or receive value from, the starting point show the stage and associated members. The percentage for each allocation is displayed, from highest to lowest.

    The percentages displayed for a stage will not equal 100% if the following conditions exist:

    • If there are idle costs on an intersection.

    • If there is cost input at a destination when drilling upstream (back to the source).


    The Trace Allocation Detail displays the direct allocations for the selected intersection.
  13. Double-click the stage header to expand and view the intersections that are included in the allocation. The source and destination intersections are highlighted.
  14. Click any intersection to view its details in the Properties pane at the bottom of the screen.

    The following details are displayed:

    • Under Source Detail:

      • Source displays the dimension members included in the intersection from which the value has been contributed

      • Net Cost For Assignment

      • Idle Cost, if any

      • Cost Assigned

      • Total Driver Value

      • OverDriven, if any

      • Standard Rate, if any

    • Under Allocation Detail:

      • Amount of the allocation

      • Driver Name

      • Driver Value

    • Under Destination Detail:

      • Destination displays the dimension members included in the intersection to which the value is allocated

      • Cost Received

      • Cost Input

      • Net Cost For Assignment

  15. Follow the flow throughout the model, as required:
    • Use expand Expand icon to follow the direct allocations throughout the model

    • Use collapse Collapse icon to close the list of intersections.