Reviewing Impact Analysis Using the Software Update Dashboard (Release 9.2.8)
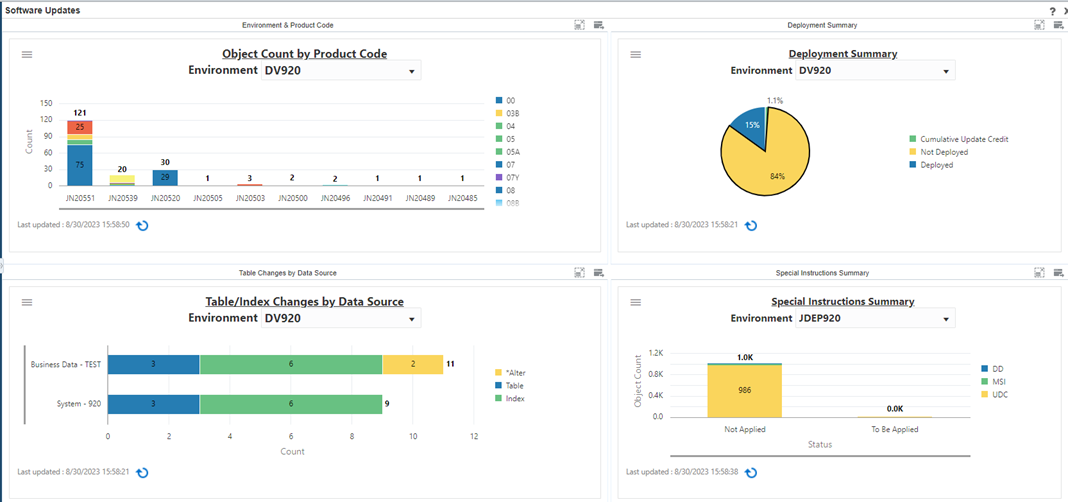
The Impact Analysis Dashboard provides a comprehensive interface to visualize the objects and business processes that are updated when a patch is applied to your system.
The data displayed in the Impact Analysis Dashboard is based on the impact analysis configuration setup (see Configuring the Impact Analysis Environment) and the impact analysis results (See Reviewing the Impact Analysis Results).
Access the Impact Analysis Dashboard from the Update Manager Process Flow page.
- Object Count by Product Code
- Deployment Summary
- Table/Index Changes by Data Source
- Special Instructions Summary

Each of the dashboard components displays a graphical chart that summarizes the view. Click the menu to open the pane with filter criteria. Set the filter/query and click OK. The dashboard also provides exportable tabular data for external consumption. You can click the component heading to drill down to the corresponding impact analysis application.
Object Count by Product Code
Use the Object Count by Product Code chart to view object usage totals by product code for the specified environment.
- The Query field allows you to set any of the preexisting queries or, you can create your own query and save it for future use.
- The Product Code field determines the product to which the data pertains.
- The Environment field determines the target environment for the data.
Deployment Summary
Use the Deployment Summary chart to view the deployment summary for the specified environment. The chart details the deployment status of the ESU. Click the Deployment Summary link to drill back to the Impact Analysis Summary View form. This form shows the percentage of replaced objects and for the replaced objects the chart summarizes the percentage of customized, not customized, and copied objects.
- The Query field allows you to set any of the preexisting queries, or you can create your own query and save it for future use.
- The Product Code field determines the product to which the data pertains.
- The Environment field determines the target environment for the data.
Table/Index Changes by Data Source
Use the Table/Index Changes by Data Source chart to view all the table and index changes for the specified environment by product code.
- The Query field allows you to set any of the preexisting queries, or you can create your own query and save it for future use.
- The Product Code field determines the product to which the data pertains.
- The Environment field determines the target environment for the data.
Special Instructions Summary
Use the Special Instructions Summary chart to view the summary of special instructions (DD Glossary, Manual Special Instructions, and UDC Description) applied and to be applied for the ESU in the specified environment.
- The Query field allows you to set any of the preexisting queries, or you can create your own query and save it for future use.
- The Product Code field determines the product to which the data pertains.
- The Environment field determines the target environment for the data.