UX One: Service Organization Safety Page
The Service Organization Safety page (P17004X/W17004XE) enables users to receive alerts about active and severe safety incidents associated with their team. The page also provides analytical data about the type, cost, and number of incidents associated with the team.
To access the UX One Service Organization Safety page, log in to the EnterpriseOne system using the Service Operations Manager role. When you log in with this role, the system automatically displays the Service Operations Manager page. Click the Service Organization Safety task on the springboard to access the Service Organization Safety page.
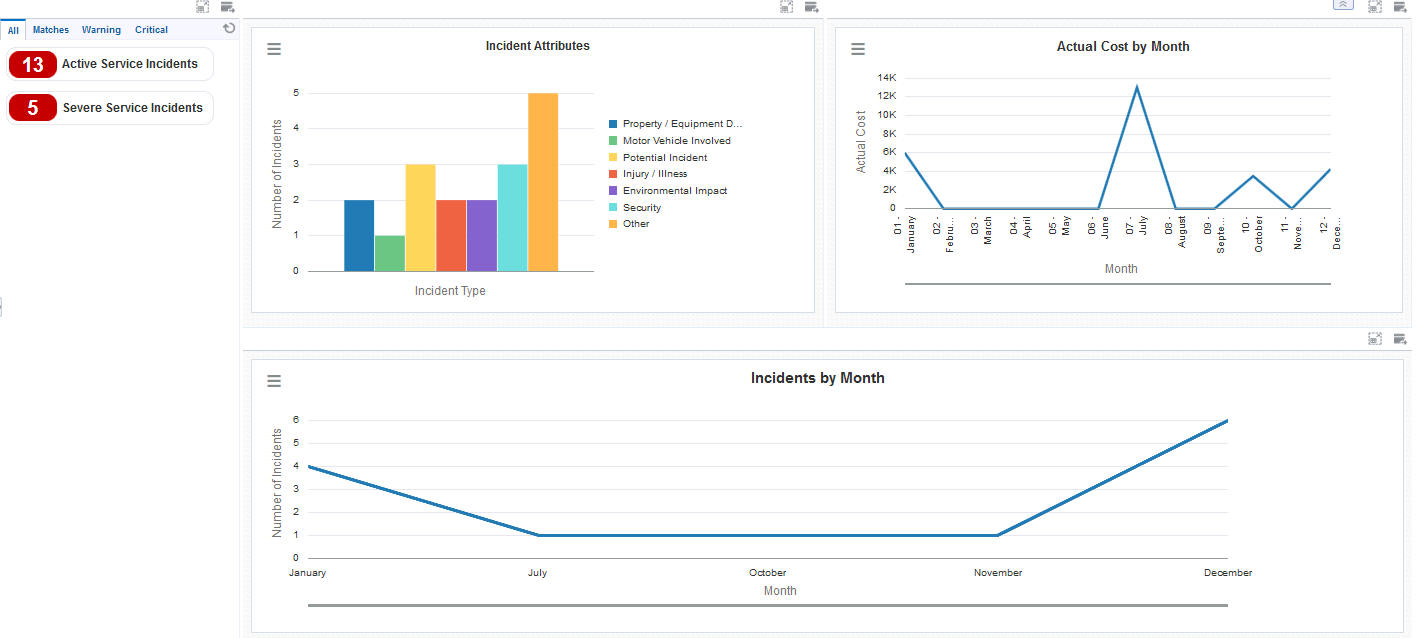
This graphic illustrates the Service Organization Safety page:
Watchlist Alerts
These alerts are based on EnterpriseOne programs. By default, the alerts are set up to use queries that are based on delivered demo data. Each of these queries is associated with a specific program version. To use a different query or call a different program version, you can modify these queries or create new queries that better meet your requirements. Additionally, these watchlists have been set up with specific warning and critical threshold values. You can adjust these values to meet your requirements.
This table lists and describes the watchlist alerts that are available on the Service Organization Safety page:
Watchlist Alert |
Description |
|---|---|
Active Service Incidents |
This alert tells users how many active service incidents their team currently has. This alert is based on the One View Incident Summary Inquiry program (P54HS220). When you click the alert, the system displays the One View Incident Summary Inquiry form. The following grid formats are available:
|
Severe Service Incidents |
This alert tells users how many severe service incidents their team currently has. This alert is based on the One View Incident Summary Inquiry program (P54HS220). When you click the alert, the system displays the One View Incident Summary Inquiry form. The following grid formats are available:
|
For additional information about the programs associated with these watchlist alerts, see: One View Incident Summary Inquiry (P54HS220) in the JD Edwards EnterpriseOne Applications One View Reporting User Guide.
Charts
These charts are based on EnterpriseOne programs. By default, the charts are set up to render using queries that are based on delivered demo data. Each of these queries is associated with a specific program version. To use a different query or call a different program version, you can modify these queries or create new queries that better meet your requirements.
This table lists and describes the charts that are available on the Service Organization Safety page:
Component Title |
Description |
|---|---|
Incident Attributes (P54HS22X/W54HS22XD) |
Use this chart to view the total number of incidents for your team. This chart is based on the One View Incident Summary Inquiry program (P54HS220). |
Actual Cost by Month (P54HS22X/W54HS22XB) |
Use this chart to view the cost by month of the incidents for your team. This chart is based on the One View Incident Summary Inquiry program (P54HS220). |
Incidents by Month (P54HS22X/W54HS22XA) |
Use this chart to view the number of incidents for your team by month. This chart is based on the One View Incident Summary Inquiry program (P54HS220). |
For additional information about the programs associated with these charts, see One View Incident Summary Inquiry (P54HS220) in the JD Edwards EnterpriseOne Applications One View Reporting User Guide.