Understanding Enterprise Process Manager User Interface
The Enterprise Process Manager window displays the enterprise process diagram while you are creating the process model.
The window displays icons for filtering and refining the data displayed on the enterprise process diagram and analytics tabs. You can hover your mouse over the icons and tabs to view the label of the component. See Creating an Enterprise Process.
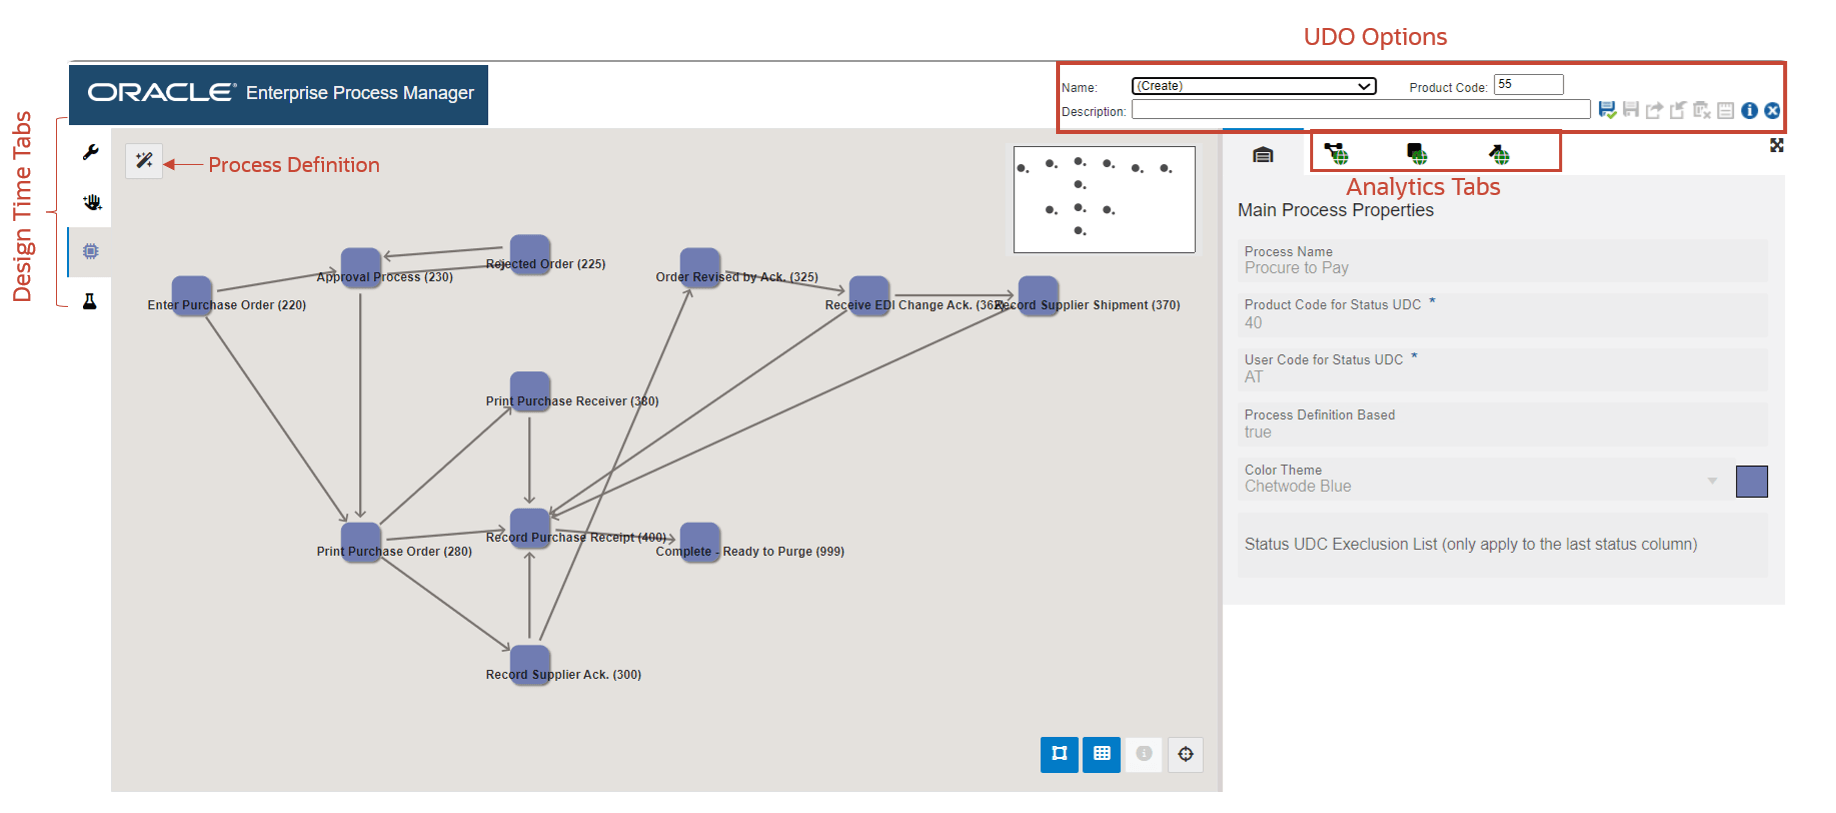
The enterprise process diagram displays nodes and the links between the nodes. The nodes represent the tasks in the process and the links represent the connection between the nodes.
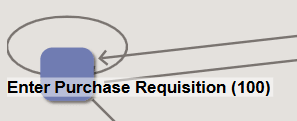
(Tools Release 9.2.9.3) You may see a loop around the node as shown in the following screenshot. The system displays a loop around the node in the design mode if an activity rule involves a self-referential loop (for example, transitioning from the 400 status back to the 400 status within the activity rules).
Process Definition : Displays the tab with basic, filter, and status configuration details. This
tab is read-only when inherited from a template, but editable in user-defined
processes.
: Displays the tab with basic, filter, and status configuration details. This
tab is read-only when inherited from a template, but editable in user-defined
processes.
Design Time Tabs
The Enterprise Process Manager window displays the following tabs with design time details on the left side of the interface:
- Design Option (read-only when inherited from a template, but editable in
user-defined processes)

- Data Filtering and Grouping Options (read-only when inherited from a
template, but editable in user-defined processes)

- Process Model (The selected color theme and name of the process is displayed
on this tab)
 : Displays the automatically generated process model diagram.
 (Tools Release 9.2.9.3) If you are creating a process model from a template and the template contains a connected process, the child Process Model tab is displayed below the parent Process Model tab. The selected color theme and name of the connected process are displayed on the child process tab.
- Preview
 : Displays the preview of the runtime view for the process model. The
preview approximates how your users will see the process model in Enterprise Process
Modeler.Note: This tab will not be displayed if there are any validation errors in the process design.
: Displays the preview of the runtime view for the process model. The
preview approximates how your users will see the process model in Enterprise Process
Modeler.Note: This tab will not be displayed if there are any validation errors in the process design.
These analytics tabs are displayed in the Enterprise Process Manager window on the right:
- Main Process Properties

- Process Metrics

- Nodes Metrics

- Links Metrics

Preview Tab
In the Preview tab, the metrics and colors displayed on the nodes and links are based on the values selected in the Node Metrics and Link Metrics fields.
(Tools Release 9.2.9.3) You may see a self-referential loop around the node. In the Preview tab, the self-referential loop displays the appropriate metric values depending on the options defined in the Show Display Options and Show Filter Options windows.
You can drag and drop the nodes to the desired location, and use the Snap to Grid  , Snap to Node
  , and Zoom to Fit
 options to make changes to your layout.
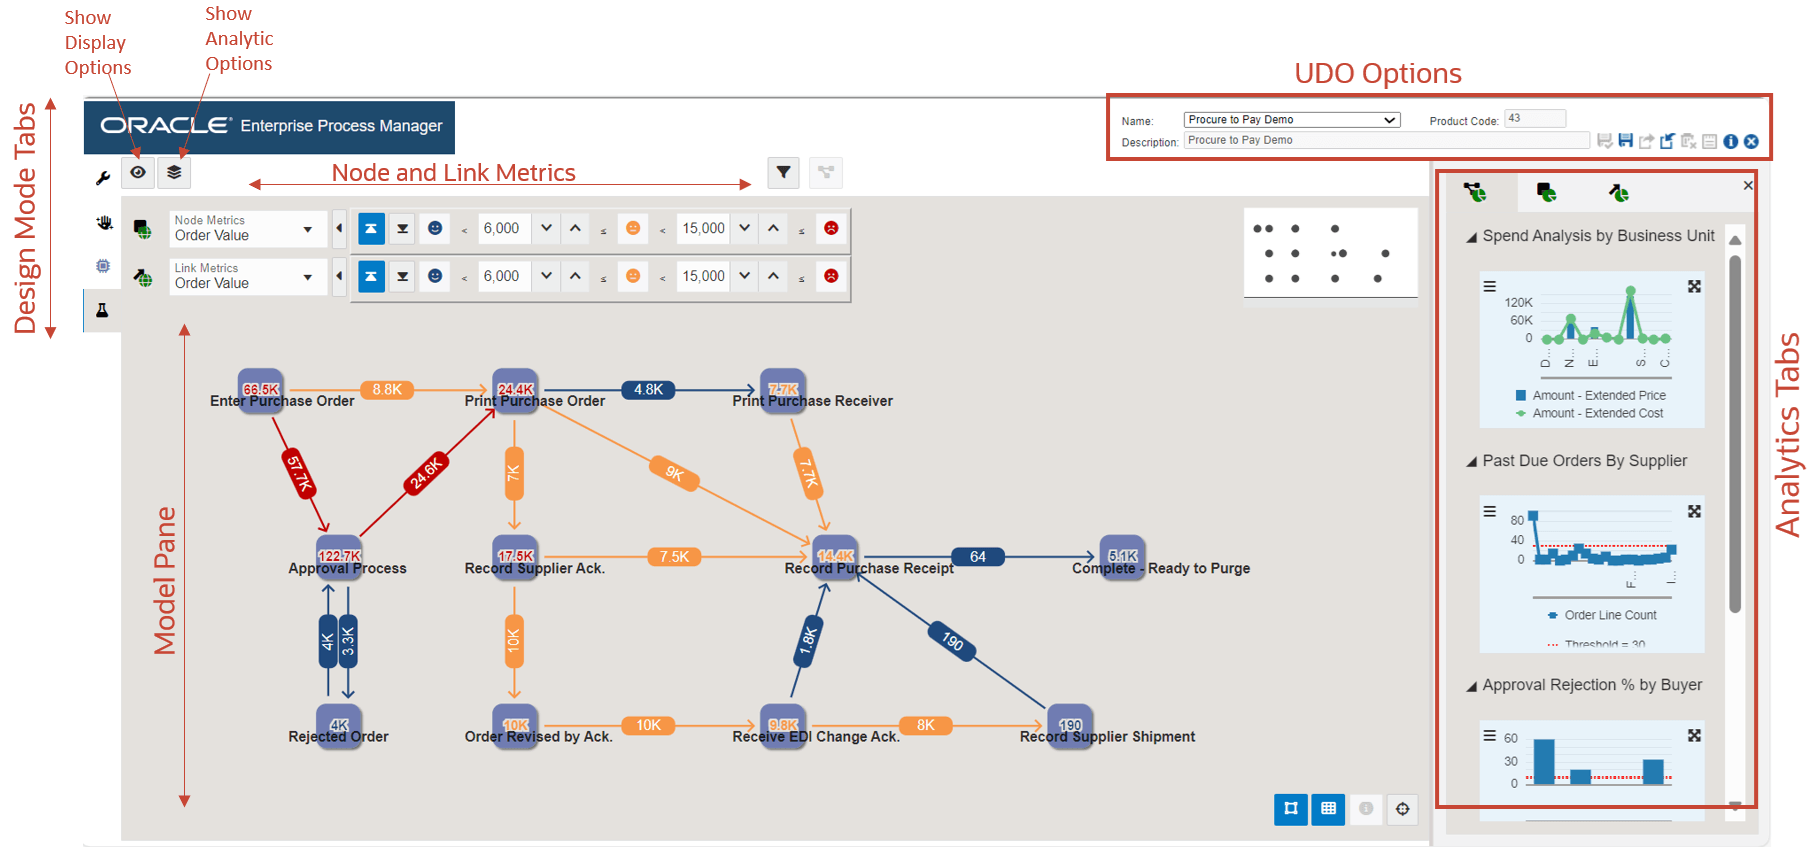
You can use the following icons available above the model pane to view display, analytics, and filter options:
-
Show Display Options

When you click this icon, the system displays a left pane with display options. You can click the Hide View Options (X) icon to close this pane.
-
Show Analytics Options

When you click this icon, the system displays a left pane with analytics options. You can click the Hide View Options (X) icon to close this pane.
-
Show Filter Options

When you click this icon, the system displays a top pane (on top of the model pane) with filter options. You can click the Hide Filter Options (X) icon to close this pane.
The tabs at the right display the graphs to view analytical details of the enterprise
process diagram, and you can refine the data displayed on the graphs by using the
Configure icon on each graph. You can also hide and unhide the analytics tabs by using
the Hide Context Analytics
icon on each graph. You can also hide and unhide the analytics tabs by using
the Hide Context Analytics 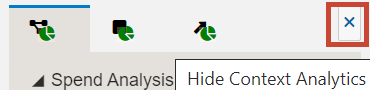 and Show Context Analytics
  icons. You can click the arrow icons to collapse or expand the individual graphs
in the analytics tabs. Also, you can click the Maximize
icons. You can click the arrow icons to collapse or expand the individual graphs
in the analytics tabs. Also, you can click the Maximize or Minimize
  icons on the graphs to view them in maximized or minimized modes.
The system displays the Click to set the context to the process level icon when the Node Analytics and Link Analytics tabs are displayed. You can click
this icon to view the Process Analytics tab.
when the Node Analytics and Link Analytics tabs are displayed. You can click
this icon to view the Process Analytics tab.
Between the left pane (displayed when you click Show Display Options or Show Analytic Options), model pane, and analytics pane, there is a resize area, which is highlighted when you hover over with your mouse cursor. You can drag it left or right to resize the panes.
UDO Options
Because a process model is a user-defined object, the system displays the standard UDO options at the top of the window: Save, Save As, Request to Publish, Reserve, Delete, and Notes.