Understanding Analytic Model Properties
Use the Analytic Model Viewer page (PTATSRCHPG2) to search for existing analytic models.
If you have already created an analytic instance and do not need to change any of its settings, you can use the Analytic Model Viewer to search for, load, and open the analytic instance. (If the instance is not loaded, clicking its name both loads and opens it; if it is loaded, clicking its name opens the instance.) When you open an analytic instance, the Analytic Model Viewer opens to a Properties tab, which displays the parts, properties, and data of the current analytic instance.
See Creating, Deleting, and Copying Analytic Instances, Loading and Unloading Analytic Instances.
Navigation:
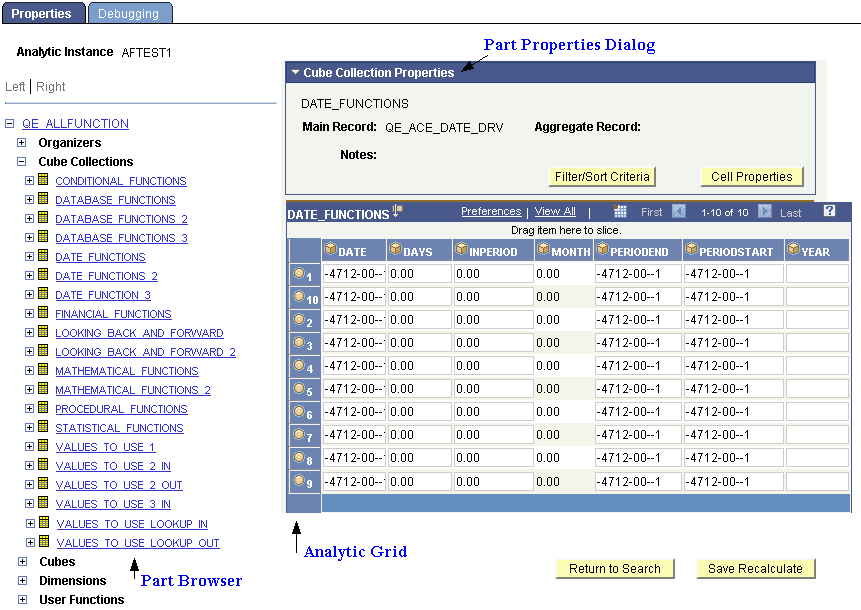
This example illustrates the fields and controls on the Analytic Model Viewer - Properties tab. Definitions for the fields and controls appear following the example.
| Term | Definition |
|---|---|
|
Part browser |
Contains hierarchies that you use to view and debug the parts of the current analytic instance. This part browser is similar to the one in PeopleSoft Application Designer. For example, if you drill into a cube collection it expands to display the specific cube collections in the current analytic instance. You can then expand each cube collection further into data cubes and dimensions. When you click the name of any part, its associated properties appear on the right side of the page, in the Part Property dialog. See PeopleSoft Application Designer Window Components for Creating Analytic Model Definitions. |
|
Part Properties dialog |
Displays the properties of the selected part of the current analytic instance. |
|
Analytic grid |
Displays the data for the part selected in the Part browser. For example, if you select the Product Sales data cube, an analytic grid displaying Product Sales data appears. You can update the data in the analytic grid and recalculate the analytic instance. This analytic grid looks and feels like the analytic grid that you add to PeopleSoft pages to display data from the analytic server. You can use it to view, edit, and drag and drop data from an analytic model. See Understanding Analytic Grid Design, Applications User’s Guide: Working with Analytic Grids. |
|
Debugging tab |
Contains options that enable you to audit the selected data cube, or from one to three data cubes from the selected cube collection. You can use this feature to view All Causes, All Effects, All Inputs, Circular System, Direct Causes, and Direct Effects. Like the Properties tab, the Debugging tab includes a Part browser, a Part Property dialog, and an analytic grid. In addition, it displays an audit grid that displays the audited data when you click the View button. |