Using Manual Network Integration Processing Verification
This section discusses how to:
-
Set up manual network integration processing verification options.
-
Manually verify network integration processing.
-
View results of manual network integration processing verification.
-
View integration processing status details.
-
View diagnostic information.
Setting Up Manual Integration Verification Options
You can set options on the Network Status Setup page to specify the number of days for which to verify processing and enable the return of diagnostic information if the system detects errors in integration processing.
To set up manual integration status options:
-
Access the Network Status Setup page ( and click the Network Status Setup link. The Network Status Setup page appears.
-
In the Last Number of Days field, enter the number of days for which to check processing status.
-
Select the Include Diagnostic Information box for the system to return diagnostics if the system determines integrations are not being processed.
-
Select the Optional Information box for the system to return additional diagnostics information if the system determines integrations are not being processed.
-
Click the Save button.
-
Click the Return to Network Status link to return to the Network Status page.
Manually Verifying Network Integration Status
To manually verify network integration status:
-
Access the Network Status Setup page ( The Network Status page appears.
-
In the Network Nodes Status Results section select the nodes to include in the verification.
By default, all network nodes are selected. To exclude a node, check the Select box next to the node name. To include the node, check the Select box again.
-
Click the Network Integration Status button.
The results of the status verification appear in Network Nodes Status Results grid. Viewing the results is described elsewhere in this topic.
Viewing Results of Manual Network Integration Processing Verification
After you perform a manual network integration processing verification, the results appear on the Network Status page in the Network Node Status Results grid.
The following table lists the possible results from manual network integration processing verification:
| Field or Control | Description |
|---|---|
|
|
A green check mark icon indicates that integrations are being processed between the default local node and the indicated remote network node. |
|
|
A yellow triangle icon indicates successful connectivity to the indicated remote node, however one of the following conditions exists:
|
|
|
A red “X” icon indicates that the integration status check failed. A Details link appears in the results grid. Click the link to view the Status Details page to view transaction errors by node. The system displays additional information per transaction to easily access information in the Network Monitor and Transactional Tracker. In addition, if you selected to include integration processing diagnostics, can you access the diagnostic information form the Status Details page. |


View Integration Processing Status Details
Use the Status Details page to view additional information, if available, about the processing status between the default local node and a remote network node.
To access the Status Details page from the Network Node Status Results grid, click the Details link.
This example illustrates the fields and controls on the Status Details page. You can find definitions for the fields and controls later on this page.
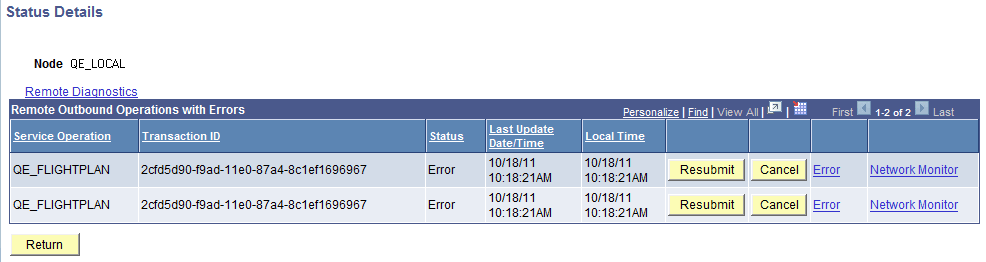
The page features the following fields and controls:
| Field or Control | Description |
|---|---|
|
Node |
Name of the sending node. |
|
Diagnostics |
Click the link to view diagnostic information. |
|
Inactive Domain |
This link appears only if the pub/sub domain on the remote node is inactive. Click the link to activate the remote domain. |
|
Remote Outbound Operations with Errors |
This grid provides access to information and actions you can take on errors on outbound service operations to remote network nodes. |
|
Remote Inbound Operations with Errors |
This grid provides access to information and action you can take on errors on inbound service operations from remote network nodes. |
|
Node |
Name of the local default node. |
|
Diagnostics |
Click the link to view diagnostic information. |
|
Service Operation |
Service operation name. |
|
Transaction ID |
Unique numeric transaction identifier. |
|
Status |
Indicates the status of the transaction. The possible values are the same that can appear in the Service Operations Monitor for asynchronous and synchronous transactions, including Error, Timeout, Standby and others. See Integration Broker Service Operations Monitor: Understanding Asynchronous Service Operations Statuses and Integration Broker Service Operations Monitor: Understanding Synchronous Service Operation Statuses |
|
Last Update Date/Time |
Indicates the update date/time the transaction was last updated. The time displayed is that which is defined on the remote system. |
|
Local Time |
Indicates the time as defined on the local system. |
|
Resubmit |
Click the button to resubmit the transaction for processing. |
|
Cancel |
Click the button to cancel the transaction for processing. |
|
Error |
Click the link to view additional error details, when available. |
|
Network Monitor |
Click the link to access the transaction in the Network Monitor for additional information and troubleshooting. |
|
Return |
Click the button to return to the Network Status page. |
Viewing Diagnostic Information
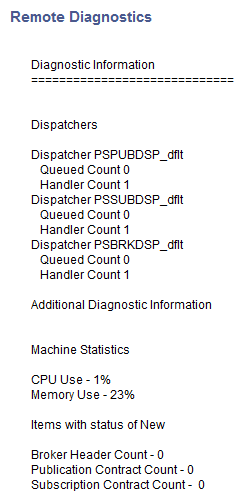
If on the Network Setup Options page you selected the diagnostic option, the system will return diagnostic information when integration processing errors are detected on the remote system. The information appears in the Remote Diagnostics page. To access the page, click the Diagnostics link on the Status Details page.
This example illustrates the Remote Diagnostics page.