Viewing Network Synchronous Transactional Details
This section describes using the Synchronous Tracker View page to view integration network synchronous transactional details.
Understanding Integration Network Synchronous Processing Status Information
Synchronous transactional detail information that the Transactional Tracker provides includes processing status information for service operations.
The processing statuses that the Transactional Tracker uses for synchronous service operations are the same as those used in the Service Operations Monitor. The statuses for synchronous service operations are:
| Field or Control | Description |
|---|---|
|
Done |
Indicates the synchronous request was successful. |
|
Error |
Indicates that an error occurred during processing. Manual intervention is required. |
See Integration Broker Service Operations Monitor: Understanding Synchronous Service Operation Statuses.
Prerequisites for Viewing Integration Network Synchronous Transactional Details
Before using the Synchronous Tracker View page see the Prerequisites for Using the Transactional Tracker.
As part of the query results for synchronous transaction queries the system provides a Details link. The Detail link provides access to the Synchronous Details page in the Service Operations Monitor where you can view logging information. To access and view the logs you must set the logging level on the routing definition of all service operations for which you want to view logging information.
Viewing Integration Network Synchronous Transactional Details
Use the Synchronous Tracker View page (IB_INTNET_TRACKSYN) to view details for synchronous transactions between the local node and remote nodes in the integration network. The page enables you to view the transaction IDs, timestamps, service operation name, service operation version, service operation type, and more for integration network synchronous transactions.
To access the page select Then in the WorkCenter navigation pane click the Transactional Tracker link, and click the Synchronous Tracker View page.
This example illustrates the fields and controls on the Transactional Tracker – Synchronous Tracker View page. You can find definitions for the fields and controls later on this page.
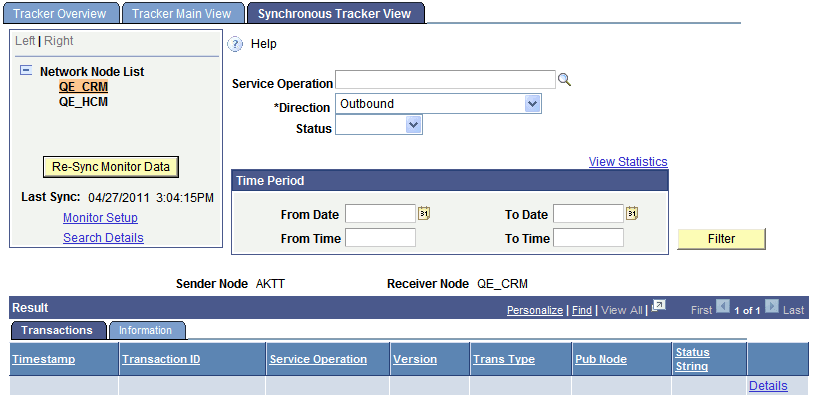
When you access the page, click the Re-Sync Monitor Data button fetch the data. The system displays the query results in the Results grid, based on the default filters.
This example illustrates query results for the QE_CRM node based on the default Outbound direction filter and clicking the Re-Sync Monitor Data button
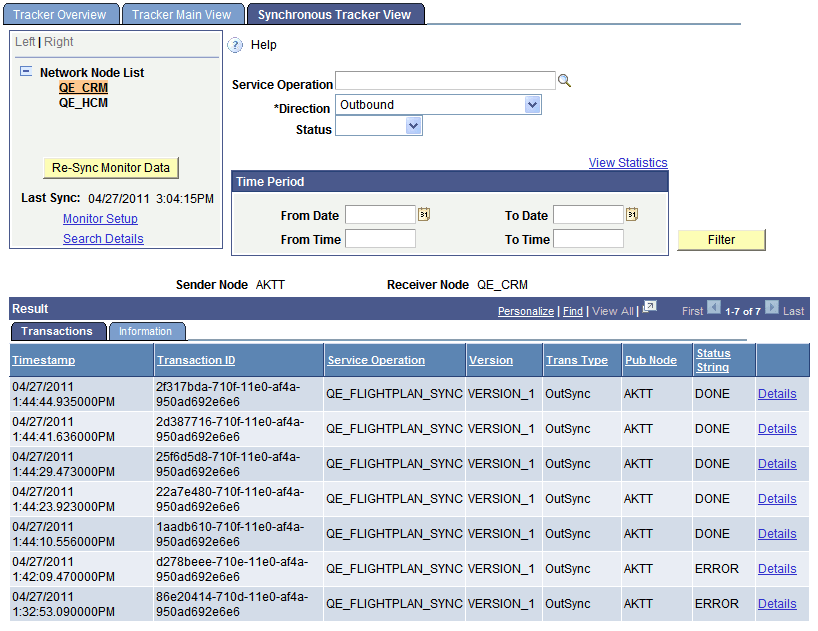
As with all the pages in the Transactional Tracker, the Synchronous Tracker View page features several filter options so that you can view the most relevant data for your business requirements. After you select filter options, click the Filter button to apply the filter(s). View the results in the Results grid. The valid data filters for the Synchronous Tracker View page are:
| Field or Control | Description |
|---|---|
|
Service Operation |
Use this option to filter transaction data by service operation. Enter the service operation name or click the Lookup button to search the database for a value. |
|
Direction |
Indicates the direction of the transaction. The valid values are:
|
|
Status |
Filter the fetched results by the processing status of the service operation. The valid values are:
|
|
Time Period |
Use the options in the Time Period group box to limit the query results to transactions that occurred during a specific date range or that occurred between a specific date and time range. The Time Period group box features four fields for searching by date and time: From Date, To Date, From Time and To Time. If you complete just the date fields, the time fields automatically populate from 12:01 a.m. to 11:59 p.m. When left blank, no date or time is used as part of the search criteria. |
After a query the results appear on the Transactions and Information tabs in the Results grid.
The following information appears in the Results grid on the Transactions tab:
| Field or Control | Description |
|---|---|
|
Timestamp |
The date and time the service operation was sent to the receiving node. |
|
Transaction ID |
The unique identifier for the transaction in the PeopleSoft system. |
|
Service Operation |
The name of the service operation. |
|
Version |
The service operation version. |
|
Trans Type |
The service operation type. The valid values are:
|
|
Pub Node |
The name of the node sending the transaction. |
|
String Status |
The processing status of the service operation. The valid values are:
|
|
Details |
Click the Details link to access the transaction in the Service Operations Monitor – Synchronous Details and view logging and error information. To capture logging information for a service operation you must set the logging level on the routing definition of the service operation. The Routings - Routing Definitions page features a Log Details drop-down list for setting the log level. |
The following information appears in the Results grid on the Information tab:
| Field or Control | Description |
|---|---|
|
Publisher |
Publisher of the service operation. This is usually the user ID of the person in the publishing system who triggered the publication. |
|
Last Upd DtTm |
Indicates the date and time the transaction was last updated. |
|
NRID |
Nonrepudiation ID. Identifies a unique number used to associate a service operation instance with the nonrepudiation log. |
|
Dest Pub Node |
Destination publish node. Identifies the name of the node where the service operation was sent. |
|
Final Dest Node |
Final destination node. Identifies the name of the node of the final destination for the service operation. |
|
Details |
Click the Details link to access the transaction in the Service Operations Monitor – Synchronous Details and view logging and error information. To capture logging information for a service operation you must set the logging level on the routing definition of the service operation. The Routings - Routing Definitions page features a Log Details drop-down list for setting the log level. |
Related Topics