Creating a Chart with Two Y-Axes
When the values in a chart vary widely from data series to data series, or when you have mixed types of data (for example, both revenue and quantity data), you can plot the additional data series on a second vertical axis referred to as a “secondary y-axis” (or Y2 axis). The scale of the secondary y-axis reflects the values for the associated data series.
Two y-axes can only be displayed for bar charts, horizontal bar charts, stacked bar charts, horizontal stacked bar charts, and the line charts. In addition, you must specify multiple fields when you invoke the SetDataYAxis method; you cannot display multiple y-axes when only one field is specified.
Consider the following table of revenue data:
| Account Name | Year | Actual | Budget | Forecast | Quantity |
|---|---|---|---|---|---|
|
Revenue |
2011 |
12000 |
14000 |
15000 |
500 |
|
Revenue |
2012 |
21000 |
20000 |
22000 |
800 |
|
Revenue |
2013 |
15000 |
16000 |
12000 |
110 |
One set of data (quantity) varies widely from the other three sets– actual revenue, budgeted revenue, and forecast revenue. All of the revenue can be plotted on the primary y-axis and quantity on the secondary y-axis. The x-axis (year) is common between the two y-axes.
Use certain PeopleCode methods and properties to specify the format of charts with two y-axes. Use the SetDataYAxis method to specify all of the fields that will be plotted on the y-axes. In this example, the four fields are specified as follows:
&oChart.SetDataYAxis(QE_COL_MULTI_2Y.LY_AMOUNT_ACTUAL, QE_COL_MULTI_2Y.LY_AMOUNT_BUDGET, QE_COL_MULTI_2Y.LY_AMOUNT_FORCAST, QE_COL_MULTI_2Y.QE_QUANTTY);Then, use the SetYAxisColumnType method to specify which values appear on the primary y-axis and which appear on the secondary y-axis. Use the following constants to indicate which axis:
| Constant | Description |
|---|---|
|
%Axis_Y |
Associate column to the primary y-axis. |
|
%Axix_Y2 |
Associate column to the secondary y-axis. |
For example, only the fourth field will appear on the secondary y-axis:
&oChart.SetYAxisColumnType(CreateArray(%Axis_Y, %Axis_Y, %Axis_Y, %Axis_Y2));You can use the Y2AxisTitle property to specify the title for the secondary y-axis. For example:
&oChart.Y2AxisTitle = "Quantity";The following example displays the revenue data plotted on the primary y-axis and the quantity data plotted on the secondary y-axis:
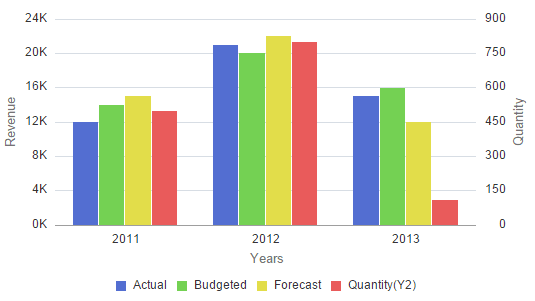
The following PeopleCode was used to generate the preceding chart:
Component Chart &oChart;

&oChart = GetChart(QE_JET_2YWRK.QE_CHART_FIELD);
&oChart.Reset();
&oChart.Type = %ChartType_2DBar;

rem Set the record for chart data;
&oChart.SetData(Record.QE_COL_MULTI_2Y);

rem Specify the field for the x-axis;
&oChart.SetDataXAxis(QE_COL_MULTI_2Y.LY_YEARS);

rem Specify multiple fields for the y-axes;
&oChart.SetDataYAxis(QE_COL_MULTI_2Y.LY_AMOUNT_ACTUAL, QE_COL_MULTI_2Y.LY_AMOUNT_BUDGET, QE_COL_MULTI_2Y.LY_AMOUNT_FORCAST, QE_COL_MULTI_2Y.QE_QUANTTY);

&oChart.SetSeriesLabels(CreateArray("Actual", "Budgeted", "Forecast", "Quantity"));

rem Specify which fields appear on which y-axis;
&oChart.SetYAxisColumnType(CreateArray(%Axis_Y, %Axis_Y, %Axis_Y, %Axis_Y2));

&oChart.XAxisTitle = "Years";
&oChart.YAxisTitle = "Revenue";
&oChart.Y2AxisTitle = "Quantity";

rem Specify whether the Y2 axis is split from the primary y-axis;
&oChart.IsSplitDualY = False;

&oChart.HasLegend = True;
&oChart.LegendPosition = %ChartLegend_Bottom;
With the addition of the following PeopleCode excerpt that instantiates a Series object, the preceding PeopleCode program will plot the secondary y-axis data as a line chart instead of as a bar chart:
rem defining new Series object with its type;
Local Series &S1;

&S1 = GetSeries();
&S1.Name = "Quantity";
&S1.Type = %SeriesType_Line;
&jSeries = CreateArray(&S1);
&oChart.SetSeries(CreateArray(&S1));
In the following chart example, the a Series object is used to plot data on the secondary y-axis as a line chart to visually differentiate it from the revenue data:
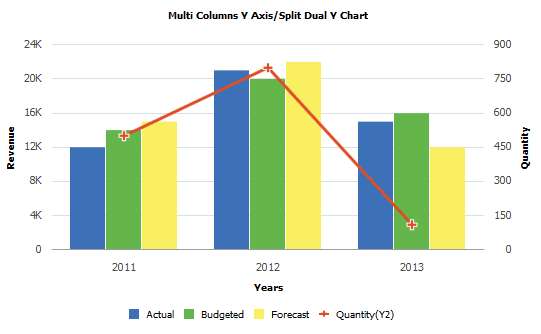
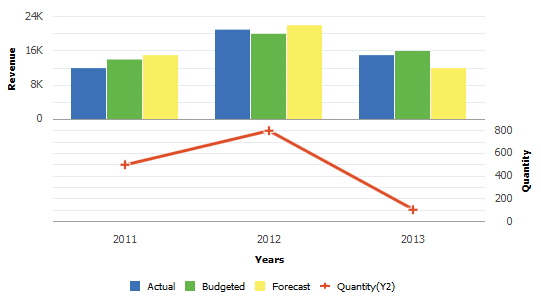
In addition, the IsSplitDualY property allows you to split the chart into two charts: one displaying the primary y-axis and the displaying the secondary y-axis.
Set IsSplitDualY to True to create a chart similar to the following:
Additional properties provide ways for you to modify the secondary y-axis including: IsY2AxisInteger, Y2AxisMin, Y2AxisMax, and Y2AxisPrecision.