Creating a Gantt Chart
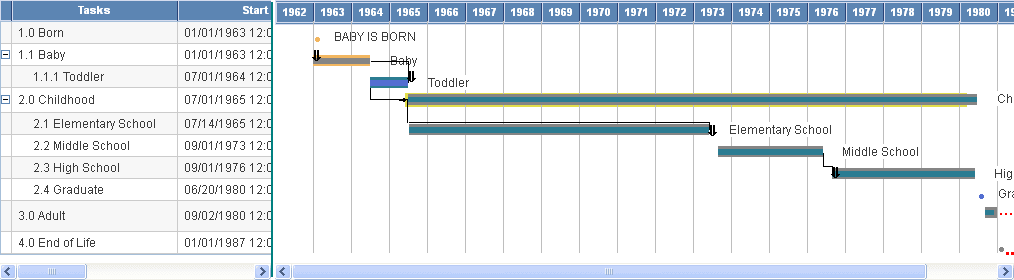
The PeopleCode and data used in this example create the following Gantt chart:
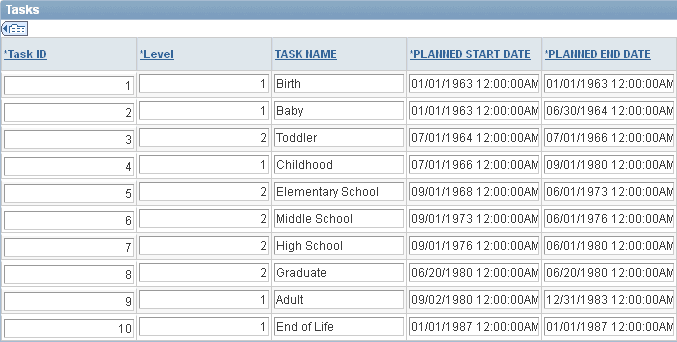
This example uses the following data in the record QE_GANTT_TASK:
This example illustrates Gantt task data:
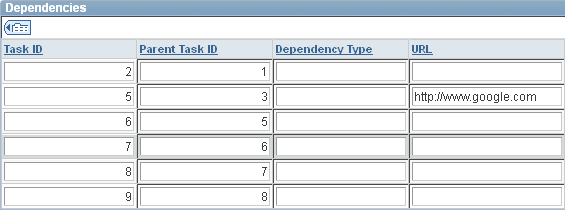
The chart also uses the following dependency data in the record QE_GANTT_TASKD:
This example illustrates Gantt dependency data:
To create a Gantt chart:
-
In Application Designer, add a chart control to a page and associate the chart control with a record name and a field name.
-
Initialize a Gantt chart object.
Initialize the chart using the GetGanttChart function. The arguments of the function are the record and field name specified for the chart definition in Application Designer.
Local Gantt &gGantt; &gGantt = GetGanttChart(QE_CHART_DUMREC.QE_CHART_FIELD); -
Specify values for the required methods.
At a minimum, specify the source of the task data and which fields contain task ID, start date, and end date.
&gGantt.SetTaskData(Record.QE_GANTT_TASK); &gGantt.SetTaskID(QE_GANTT_TASK.QE_TASK_ID); &gGantt.SetPlannedStartDate(QE_GANTT_TASK.QE_PLANNED_START); &gGantt.SetPlannedEndDate(QE_GANTT_TASK.QE_PLANNED_END); -
Specify values for the additional methods controlling the appearance of the data.
After setting the required methods, you can set additional methods to control the appearance of the chart. The following code specifies the percentage of the entire chart that is taken up by the chart area, the width and height of the chart, if the user can click the chart area of the Gantt chart and either execute a function or a URL, and whether labels should appear with the tasks in the task section.
&gGantt.SetChartArea(50); &gGantt.Width = 700; &gGantt.Height = 380; &gGantt.IsDrillable = True; &gGantt.ShowTaskLabels = True; -
Specify the appearance of grid lines.
Depending on the type of data that you are using, you can specify the type of grid lines that should appear in the chart section of the Gantt chart.
&gGantt.GridLineType = %ChartLine_Solid; &gGantt.GridLines = %ChartGrid_Vertical; -
Specify the appearance of data.
The following methods control the appearance of the different parts of the task data, such as the label, which hints appear when you pass the mouse over the task data, and so on.
&gGantt.SetTaskName(QE_GANTT_TASK.QE_TASK_NAME); &gGantt.SetWBSNumbering(QE_GANTT_TASK.QE_HINTS); &gGantt.SetTaskLevel(QE_GANTT_TASK.QE_LEVEL); &gGantt.SetTaskLabel(QE_GANTT_TASK.QE_TASK_LABEL); &gGantt.SetTaskProgress(QE_GANTT_TASK.QE_TASK_PROGRESS); &gGantt.SetTaskBarURL(QE_GANTT_TASK.QE_URL); &gGantt.SetTaskMilestone(QE_GANTT_TASK.QE_TASK_MILESTONE); &gGantt.TaskMilestoneGlyph = QE_GANTT_PROJ.QE_MILESTONE_GLYPH; &gGantt.SetPlannedTaskBarColor(QE_GANTT_TASK.QE_PLANNED_COLOR); &gGantt.SetActualTaskBarColor(QE_GANTT_TASK.QE_ACTUAL_COLOR); &gGantt.SetTaskProgressBarColor(QE_GANTT_TASK.QE_PROGRESS_COLOR); -
Specify the additional fields that will appear in the table section.
You can also specify application data that will appear with the task data.
&gGantt.SetTaskAppData(QE_GANTT_TASK.QE_PLANNED_START, QE_GANTT_TASK.QE_PLANNED_END, QE_GANTT_TASK.QE_TASK_PROGRESS, QE_GANTT_TASK.QE_TASK_NAME); -
Specify titles for the task bars.
&gGantt.TaskTitle = "Tasks"; &appDataArray = CreateArray("Start", "End", "Progress", "Name"); &gGantt.SetTaskAppDataTitles(&appDataArray); -
Specify the fields for task dependency data.
You do not need to specify dependency data. However, if you do, you must also specify the parent ID and the child ID (where the dependency data starts and ends). You can also specify the type of line used between dependencies and a URL that the browser will open to if the user clicks a dependency line.
&gGantt.SetTaskDepenencyData(Record.QE_GANTT_TASKD); &gGantt.SetTaskDependencyParentID(QE_GANTT_TASKD.QE_PARENT_TASK_ID); &gGantt.SetTaskDependencyChildID(QE_GANTT_TASKD.QE_TASK_ID); &gGantt.TaskDependencyLineType = %ChartLine_Solid; &gGantt.SetTaskDependencyURL(QE_GANTT_TASKD.URL); -
Specify the actual dates for the project.
If you know the actual start and end dates, in addition to the planned date, you can add those to your chart.
&gGantt.SetActualStartDate(QE_GANTT_TASK.QE_ACTUAL_START); &gGantt.SetActualEndDate(QE_GANTT_TASK.QE_ACTUAL_END); -
Specify the time line axis values.
You can specify values for where the time line axis starts and ends.
&gGantt.AxisStartDateTime = DateTimeValue("01/01/1963 8:00:00"); &gGantt.AxisEndDateTime = DateTimeValue("01/01/1987 8:00:00"); -
Specify the format of the time line axis values.
You can specify the format of the time line elements, such as the appearance of the days of the week, whether as a number or using the full name, and so on.
&gGantt.SetMonthFormat(%Chart_MonthFormat_FullName);
&gGantt.SetDayFormat(%Chart_DayFormat_2Digit);