Creating a Rating Box Chart
The PeopleCode used in the following example creates this rating box chart:
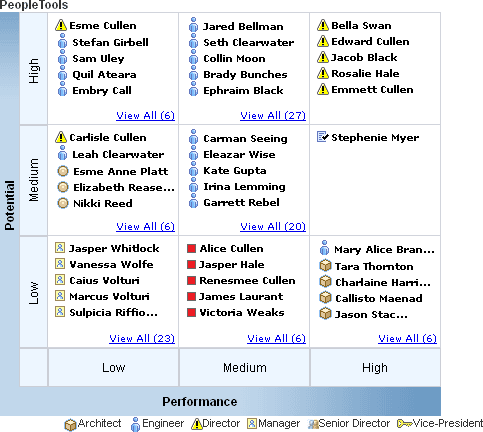
Follow these steps to create a rating box chart.
-
Create the rating box chart node record.
-
Clone the PTRATINGBOX_SBR subrecord to create an application-specific subrecord.
-
Create a new application-specific record and insert the new subrecord.
-
-
Add a chart control to a page in Application Designer.
-
Add the rating box chart node record to the component.
This record must be in the component buffer. If you do not want to give the user access to the data you can add the record to a hidden grid on the page. Alternatively, you can place it on another page in the same component.
-
Add PeopleCode.
-
In an event such as PreBuild, add PeopleCode to create a component buffer rowset that references the rating box chart node record.
-
Add PeopleCode, probably in the page Activate event, to populate the rowset and define the chart.
-
Add FieldChange PeopleCode that will execute when drag-and-drop events occur.
-
PeopleCode for the Rating Box Chart Example
Complete these steps to create a rating box chart:
-
Prepare the data for the chart.
Typically, write PeopleCode in an event such as PreBuild to populate a rowset with the data you want to display in the rating box chart.
Component Rowset &rs, &rsRatingBox; Component RatingBoxChart &rbRatingBoxChart; /* the record QE_RATEBOX_DATA has the data for the RATING BOX chart */ &rs = CreateRowset(Record.QE_RATEBOX_DATA); &rs.Fill("Where QE_RATEBOX_TC=:1", QE_RATEBOX_TC.QE_RATEBOX_TC.Value); /* Get the grid on the page for the node data and initalize to nulls */ &rsGrid = GetLevel0()(1).GetRowset(Scroll.QE_RATEBOX_TC); &rsGrid.Flush(); /* Copy data from database table, QE_RATEBOX_DATA, to the level 1 component rowset associated with the component derived working record QE_RATEBOX_DR */ &rs.CopyTo(&rsGrid, Record.QE_RATEBOX_DATA, Record.QE_RATEBOX_DR); -
Define the RatingBoxChart.
Add PeopleCode in an event such as Activate.
Instantiate a RatingBoxChart object using the GetRatingBoxChart built-in function to reference the page control field of the chart.
Component Rowset &rs, &rsGrid; Component RatingBoxChart &rbRatingBoxChart; &rbRatingBoxChart = GetRatingBoxChart(QE_CHART_DUMREC.QE_CHART_FIELD); -
Set the required display properties for the chart.
&rbRatingBoxChart.XaxisBoxNum = 3; &rbRatingBoxChart.YaxisBoxNum = 3; &rbRatingBoxChart.PopUpWidth = 200; &rbRatingBoxChart.PopUpHeight = 200; &XAxisArray = CreateArray("Low", "Medium", "High"); &YAxisArray = CreateArray("Low", "Medium", "High"); &rbRatingBoxChart.SetXAxisLabels(&XAxisArray); &rbRatingBoxChart.SetYAxisLabels(&YAxisArray); -
(Optional) Specify other values for the chart display properties.
If you do not specify these properties, the following default value will be used:
&rbRatingBoxChart.IsDragable = True; &rbRatingBoxChart.BoxMaxDisplayItems = 3; &rbRatingBoxChart.NDMaxDisplayDescLength = 25; &rbRatingBoxChart.ShowNodeDescription = True; &rbRatingBoxChart.GridLineType = %ChartLine_Solid; &rbRatingBoxChart.XAxisTitle = "Performance"; &rbRatingBoxChart.YAxisTitle = "Potential"; &rbRatingBoxChart.NDMaxDisplayDescLength = 15; &rbRatingBoxChart.BoxMaxDisplayItems = 5; &rbRatingBoxChart.Height = 400; &rbRatingBoxChart.Width = 400; &rbRatingBoxChart.ShowNodeDescription = true; &rbRatingBoxChart.GridLineType=%ChartLine_Solid; &rbRatingBoxChart.IsDragable = True; &rbRatingBoxChart. BoxMaxDisplayItems= 1; &rbRatingBoxChart. NDMaxDisplayDescLength = 50; -
(Optional) Assign style class names for the chart and x- and y-axis title and labels.
If you do not specify a style class name, the PeopleTools default style sheet is used.
&rbRatingBoxChart.Style = "PSCHARTDEFAULT"; &rbRatingBoxChart.XAxisTitleStyle = "PT_RATBOX_XTTL"; &rbRatingBoxChart.YAxisTitleStyle = "PT_RATBOY_YTTL"; &rbRatingBoxChart.XAxisLabelStyle = "PT_RATBOX_XAXIS"; &rbRatingBoxChart.YAxisLabelStyle = "PT_RATBOX_YAXIS"; -
(Optional) Specify title and legend properties.
&rbRatingBoxChart.MainTitle = "Development Division"; &rbRatingBoxChart.MainTitleStyle="PT_RATBOX_TITLE" &rbRatingBoxChart.HasLegend = True; &rbRatingBoxChart.LegendPosition = %ChartLegend_Bottom; &LegendArray = CreateArray("Architect", "Engineer", "Director", "Manager", "Senior Director", "Vice-President"); &LegendImgArray = CreateArray("PT_ACECUBE", "PT_WF_PERSON","PT_STATUS_ALERT_ICN", "PT_STATUS_ASSIGNED_ICN", "QE_SUCCSORGCHART", "QE_KPERSON"); &rbRatingBoxChart.SetLegend(&LegendArray); &rbRatingBoxChart.SetLegendImg(&LegendImgArray); -
Set the node data rowset and record.
The chart refreshes when the SetRBNodeData method is called.
/* Set the node data rowset and the node record. */ &rbRatingBoxChart.SetRBNodeData(&rsGrid); &rbRatingBoxChart.SetRBNodeRecord(Record.QE_RATEBOX_DR); -
Add FieldChange PeopleCode on the fields PTXASISRATINGS and PTYAXISRATINGS if you want to perform other logic after the drag and drop operation.
This example shows a call to the SetRBNodeData function to redraw the chart the user changes the values in either of these two fields in the component:
/* FieldChange PeopleCode for fields PTXAXISRATINGS and PTYAXISRATINGS*/
&rbRatingBoxChart.SetRBNodeData(&rsGrid);