SetDataLabel method: Chart class
Syntax
SetDataLabel(Record_Name.Field_Name1, ...)Description
Use the SetDataLabel method to set labels for each data series when multiple fields are passed to SetDataYAxis. Otherwise, each series is identified by its field name.
Parameters
| Parameter | Description |
|---|---|
|
Record_Name.Field_Name1, ... |
Specify the name of the record and one or more fields on that record that contain the labels for the data items for the chart. Note: The number and order of fields specified must correspond to the order specified by the SetDataYAxis method. |
Returns
None.
Example
Consider the following data for a chart.
Note:
For ease of viewing, the data has been split into two tables.
Chart data part 1:
| QE_PARKNAME | QE_YEARS | QE_VISITORS | QE_CHART_COLOR | QE_CHART_LABEL | QE_CHART_LABELSTYL |
|---|---|---|---|---|---|
|
ARCHES |
1970 |
1640758 |
2 |
ar |
font-size:8px; |
|
ARCHES |
2000 |
1870577 |
2 |
ar |
font-size:8px; |
|
ARCHES |
2014 |
2082866 |
2 |
ar |
font-size:8px; |
|
GLACIER |
1970 |
1153564 |
4 |
gl |
font-size:10px; |
|
GLACIER |
2000 |
1462035 |
4 |
gl |
font-size:10px; |
|
GLACIER |
2014 |
1890374 |
4 |
gl |
font-size:10px; |
|
SEQUOIA |
1970 |
1202979 |
7 |
sq |
font-size:12px; |
|
SEQUOIA |
2000 |
1306583 |
7 |
sq |
font-size:12px; |
|
SEQUOIA |
2014 |
1506584 |
7 |
sq |
font-size:12px; |
|
YELLOWSTONE |
1970 |
2294326 |
3 |
yl |
font-size:14px; |
|
YELLOWSTONE |
2000 |
2447729 |
3 |
yl |
font-size:14px; |
|
YELLOWSTONE |
2014 |
2888030 |
3 |
yl |
font-size:14px; |
|
YOSEMITE |
1970 |
2551393 |
1 |
ys |
font-size:12px; |
|
YOSEMITE |
2000 |
2853404 |
1 |
ys |
font-size:12px; |
|
YOSEMITE |
2014 |
2691191 |
1 |
ys |
font-size:12px; |
Chart data part 2:
| QE_PARKNAME | QE_CHART_POS | QE_CHART_Z | QE_CHART_MARKER | QE_CHART_MARKERSIZ |
|---|---|---|---|---|
|
ARCHES |
auto |
5 |
square |
12 |
|
ARCHES |
aboveMarker |
6 |
square |
12 |
|
ARCHES |
afterMarker |
5 |
square |
12 |
|
GLACIER |
center |
8 |
circle |
16 |
|
GLACIER |
belowMarker |
6 |
circle |
16 |
|
GLACIER |
beforeMarker |
5 |
circle |
16 |
|
SEQUOIA |
aboveMarker |
7 |
triangleDown |
9 |
|
SEQUOIA |
beforeMarker |
8 |
triangleDown |
9 |
|
SEQUOIA |
auto |
7 |
triangleDown |
9 |
|
YELLOWSTONE |
insideBarEdge |
8 |
human |
12 |
|
YELLOWSTONE |
outsideBarEdge |
7 |
plus |
12 |
|
YELLOWSTONE |
center |
8 |
diamond |
12 |
|
YOSEMITE |
aboveMarker |
7 |
triangleUp |
15 |
|
YOSEMITE |
belowMarker |
8 |
triangleUp |
15 |
|
YOSEMITE |
auto |
7 |
triangleUp |
15 |
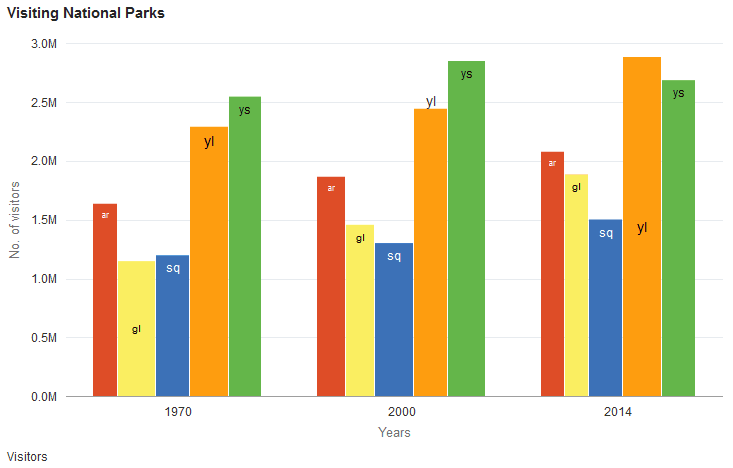
The following PeopleCode program will render the chart data as a bar chart:
rem Set up the chart;
&oChart = GetChart(QE_JET_CHARTWRK.QE_JET2);
&oChart.Reset();
&oChart.Type = %ChartType_2DBar;

rem Set chart data;
&oChart.SetData(Record.QE_CHART_NPARKS);

&oChart.SetDataYAxis(QE_CHART_NPARKS.QE_VISITORS);
&oChart.SetDataXAxis(QE_CHART_NPARKS.QE_YEARS);
&oChart.SetDataSeries(QE_CHART_NPARKS.QE_PARKNAME);
&oChart.XAxisTitle = "Years";
&oChart.YAxisTitle = "No. of visitors";
&oChart.FootNote = "Visitors";
&oChart.MainTitle = "Visiting National Parks";

rem Set data labels and markers;
&oChart.SetDataLabel(QE_CHART_NPARKS.QE_CHART_LABEL);
&oChart.SetDataLabelPosition(QE_CHART_NPARKS.QE_CHART_POS);
&oChart.SetDataLabelStyle(QE_CHART_NPARKS.QE_CHART_LABELSTYL);
&oChart.SetDataMarker(QE_CHART_NPARKS.QE_CHART_MARKER);
&oChart.SetDataMarkerSize(QE_CHART_NPARKS.QE_CHART_MARKERSIZ);

rem Set z-axis value;
&oChart.SetDataZAxis(QE_CHART_NPARKS.QE_CHART_Z);

rem for bubble charts;
rem &oChart.SetDataGlyphScale(QE_CHART_NPARKS.QE_CHART_Z);
Because bar charts do not support data markers, the chart that is rendered does not display markers.
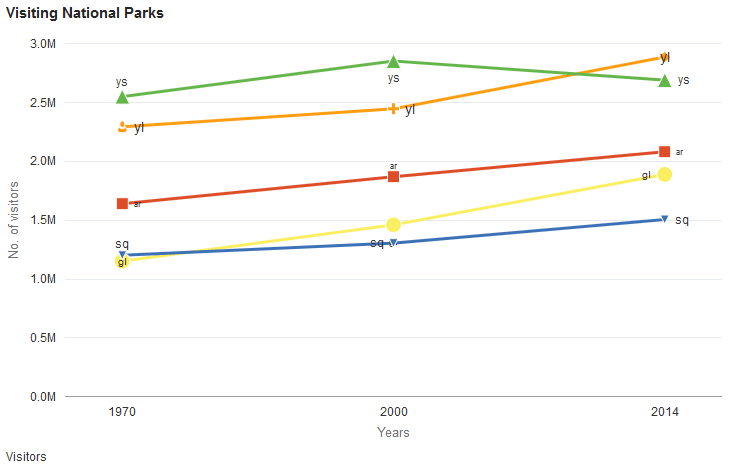
The preceding PeopleCode program can be modified to display the same data as a line chart by changing the chart type:
&oChart.Type = %ChartType_2DLine;The line chart that is rendered from the same data includes the data labels and data markers.