Using the Threshold Class
The Threshold class is used in conjunction with the two gauge classes: LEDGauge and StatusMeterGauge. The Threshold class provides a way to add reference areas and color coding to your gauges.
On the LED gauge, the Threshold class can be used to color the LED gauge according to the defined threshold values.
Creating Thresholds Using the Threshold Class
To use the Threshold class, follow these basic steps:
-
Create an instance of the Threshold class in PeopleCode by using the GetThreshold built-in function:
&thrshld = GetThreshold(); -
Set the properties on the instance of Threshold class that you created.
-
Associate the instance of the Threshold class to an instance of one of the gauge classes.
&gauge.SetThreshold(&thrshld);
Using Thresholds with Gauges
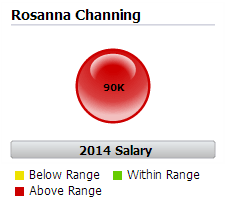
The following example presents a LED gauge with color from the Threshold class:
To render the gauge in this way, you would create an instance of the Threshold class. Each property of the Threshold class is an array that you would populate as follows:
| Values array | Colors array |
|---|---|
|
Value of first threshold |
Yellow |
|
Value of the second threshold |
Green |
|
NA |
Red |
A user-defined PeopleCode function that instantiates this instance of the Threshold class looks like this:
Function bld_thrshld Returns Threshold;
   Local Threshold &thrshld;
   &thrshld = GetThreshold();
   &thrshld.Values = CreateArray(CJY_SLRY.CJY_SLRY_MIN, CJY_SLRY.CJY_SLRY_MAX);
   &thrshld.Colors = CreateArray(%ChartColor_Yellow, %ChartColor_Green, %ChartColor_Red);
   Return &thrshld;
End-Function;
However, you can add a Descriptions array to control what is displayed in data hints and in the legend:
| Values array | Descriptions array | Colors array |
|---|---|---|
|
Value of first threshold |
Below Range |
Yellow |
|
Value of the second threshold |
Within Range |
Green |
|
NA |
Above Range |
Red |
The Descriptions array is added to the same user-defined PeopleCode function:
Function bld_thrshld Returns Threshold;
   Local Threshold &thrshld;
   &thrshld = GetThreshold();
   &thrshld.Values = CreateArray(CJY_SLRY.CJY_SLRY_MIN, CJY_SLRY.CJY_SLRY_MAX);
   &thrshld.Descriptions = CreateArray("Below Range", "Within Range", "Above Range");
   &thrshld.Colors = CreateArray(%ChartColor_Yellow, %ChartColor_Green, %ChartColor_Red);
   Return &thrshld;
End-Function;
Related Topics