Call Stack Pane
The Call Stack pane appears by default when the PeopleCode debugger is started. To reopen it, select Debug, View Call Stack Window.
The Call Stack pane displays a stack of PeopleCode functions and methods that are currently active but not completed. You can use the Call Stack pane to observe the flow of an application as it executes a series of nested functions. When a function is called, it is pushed onto the top of the stack. When the function returns, it is popped off the stack.
The Call Stack pane displays the currently executing function at the top of the stack and older function calls below that, in reverse calling order. You can navigate to the source code of a function from the call stack window. The variables panes update to reflect values for the selected function.
The Call Stack pane is updated and usable when execution is stopped at a breakpoint.
Call Stack Indicators
The Call Stack displays a current line indicator and a selected function indicator in the gutter.
The current line indicator is a green arrow that shows where in the call stack the execution stopped. The current line indicator always appears in the call stack pane.
The selected function indicator is a yellow triangle that marks the current function being displayed by the Edit and Variables windows. The selected function indicator does not appear when the current function is at the execution point.
You can hover over a function name to see the full program path in a pop-up window, as shown in the following example.
This example illustrates the fields and controls on the Call Stack pane example showing execution pointer, selected function indicator, and hover pop-up. You can find definitions for the fields and controls later on this page.

The Call Stack pane is updated, when necessary, with each change of the debug state.
Go To Source Code
Right-click on a function to access a context menu with these options:
| Options | Description |
|---|---|
|
Copy |
Copies the text of the selection in the call stack to the clipboard. |
|
Select All |
Selects all rows in the call stack. You can also use standard shift-click and CTRL-click actions to select multiple rows. |
|
Go To Source Code |
Displays the selected function in the Edit window. In addition, the active variables windows will be updated in sync with the Call Stack and Edit windows. Double-click a function name to go to the source code. |
When the displayed source code is at the execution point, the execution pointer icon (green arrow) appears in the source window.
When the displayed source code is not at the execution point, the selected function icon (yellow triangle) appears in the source window.
This example illustrates the fields and controls on the Source code pane and call stack pane showing the yellow triangle execution pointer. You can find definitions for the fields and controls later on this page.
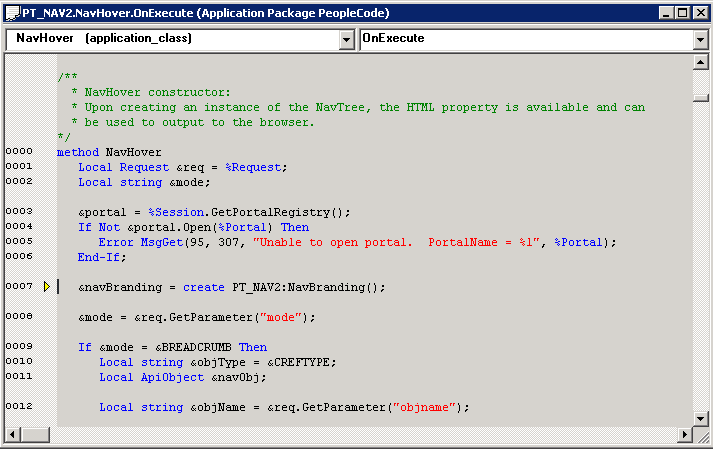
Viewing source code for functions that are not at the top of the stack does not change the point of execution. Nor does it disable the ability to continue execution. For example, in the previous example, selecting Go would cause the program execution to continue at “FUNCLIB_PORTAL.PORTAL_GEN_FUNC.FieldFormula PortalOpen” and not at the function in the source code window.
During debugging it is easier to go back to the previous code event from the call stack window as compared to trying to keep track of where the control was transferred and then finding the right opened PeopleCode window in Application Designer. This can be useful when trying to understand the component design and PeopleCode flow.