Configuring Thresholds for Individual Data Points
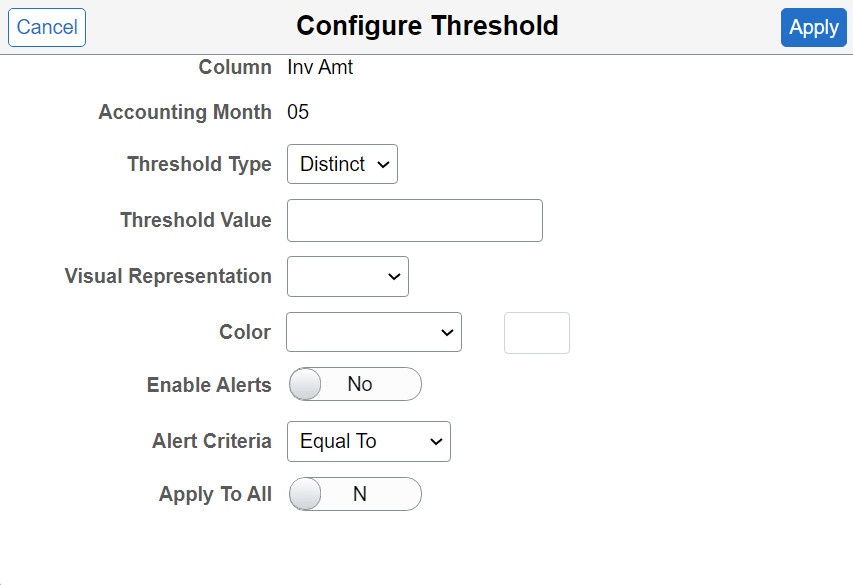
Use the Configure Threshold dialog box to configure threshold settings for individual data points on the X-axis. Note that all threshold settings are applied for both classic and fluid views.
To access the Configure Threshold dialog box:
-
In the Pivot Grid Viewer, select any data point on the grid or chart to display the Actions menu.
-
Select the Configure Threshold menu option to display the Configure Threshold dialog box.
This example illustrates the fields and controls on the Configure Threshold dialog box. Definitions for the fields and controls appear following the example.
| Field or Control | Description |
|---|---|
|
Visual Representation |
Select the visual representation type to display the threshold in Pivot Grid Viewer:
|
|
Color |
Select one color from the list of 18 available colors. The color that you select in this list will appear in the grids and the charts for the values that are above the threshold. The available colors are derived from the supported colors for PeopleSoft Charting. Note: Only one color can be specified for a threshold. |
|
Enable Alerts |
Use this switch to enable or disable alerts. |
|
Alert Criteria |
Set a condition to trigger a verification of a threshold violation when the condition is met. The drop down values are displayed according to the Threshold Type.
|
|
Apply To All |
Set this switch to N to apply the threshold configuration to a single data point. Set this switch to Y to apply the threshold configuration to all data points on the X-axis. |