Configuring Thresholds
Use the Configure Thresholds page to configure the basic threshold settings for the grids and charts. Note that all threshold settings are applied for both classic and fluid views.
-
For the grids, the thresholds will appear as colored cells if the cell values are over the threshold values that you have specified.
-
For the charts, the values in the Reference Areas and Reference Lines fields from the sub product PeopleSoft Charting are applied.
Access the Configure Thresholds page by:
-
Selecting
-
Accessing the Specify Data Model Options page - Step 4 of the wizard.
-
Clicking the Define Thresholds link displayed under Define Threshold column in the Specify Axis Information grid.
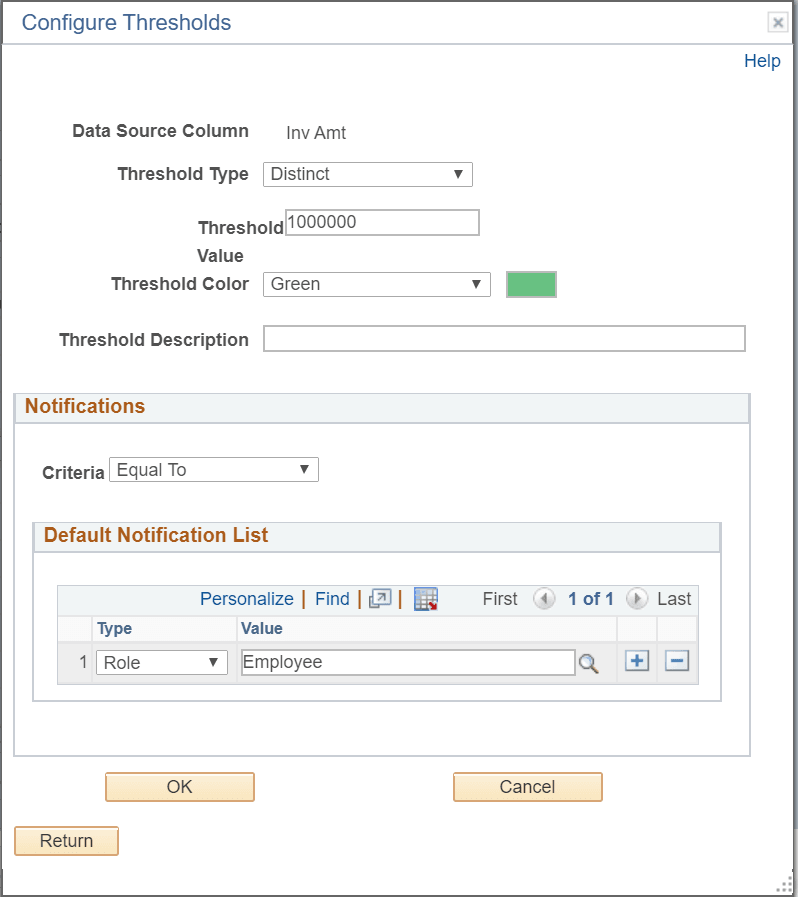
This example illustrates the fields and controls on the Configure Thresholds page. Definitions for the fields and controls appear following the example.
| Field or Control | Description |
|---|---|
|
Data Source Column |
Displays the name of the field for which the threshold is being defined. Note: Only fields that are set to Value can apply threshold. |
|
Threshold Type |
Set the threshold type. The available options are:
If the Distinct option is selected:
If the Range option is selected:
|
|
Threshold Value |
Specify a single threshold value. The field is available when the Threshold Type is set to Distinct. |
|
Lower Limit and Higher Limit |
Specify a range of minimum and maximum threshold values. These fields are available when the Threshold Type is set to Range. |
|
Threshold Color |
Select one color from the list of 18 available colors. The color that you select in this list will appear in the grids and the charts for the values that are above the threshold. The available colors are derived from the supported colors for PeopleSoft Charting. Note: Only one color can be specified for a threshold. |
|
Threshold Description |
Enter the text that will appear when you hover over the charting reference areas and lines. |
|
Criteria |
Set a condition to trigger a verification of a threshold violation when the condition is met. The dropdown values are displayed according to the Threshold Type.
Note: A consolidated notification for each fact is sent to users when the criteria matches. |
|
Default Notification List |
Select users by their user ids or roles to receive the notification. |
In addition to setting the notification conditions in the Configure Thresholds dialog box, you can opt to disable user personalization of threshold. By default pivot grid allows user personalization of threshold from the pivot grid model views of the threshold. See Display Options.