Create Analytics- Step 3
Use the Create Analytics Wizard - step 3 (PTPG_REPORT_WIZ_3) to preview the analytic reports based on the display options, fields, and prompts selected in the previous steps of the wizard. Optionally, you can modify (by dragging and dropping, applying filters, and so on) the analytic to finalize the design and then click the Save button to save the final report.
After you save the analytic you will see the Add To dropdown options.
This example illustrates the preview window of the analytic report, Create Analytics Wizard - step 3.
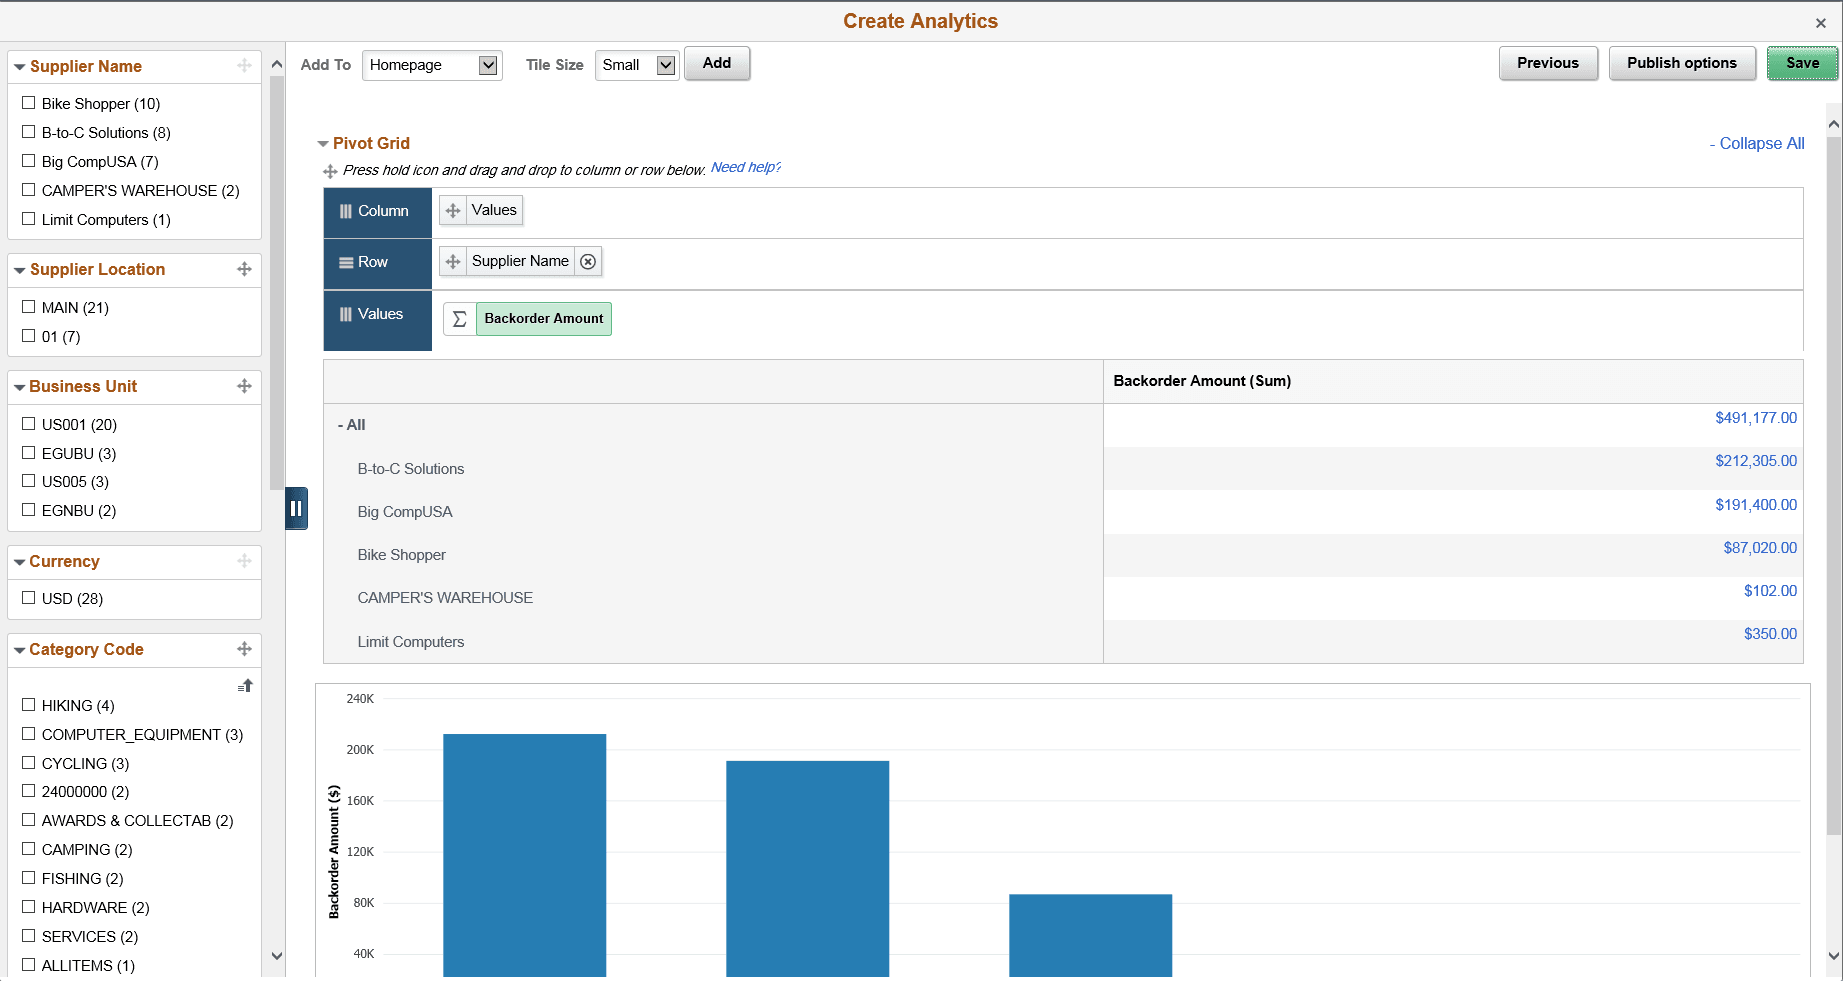
| Field or Control | Description |
|---|---|
|
Facets |
View, select, drag and drop facets to dimensions, and find the required view which you will like to publish and share with other users. |
|
Add To |
Select from the dropdown to add to:
|
|
Tile Size |
Select from tile sizes:
The sizes are available only when you add to homepage or dashboard. For the NavBar the option is disabled. |
From the preview window, you can:
-
Change the X-axis, Series, and Y-axis by dragging and dropping these dimensions from the facet area to the row or column section.
-
Change the chart type by using the chart type short cut icons.
-
Change the aggregate functions in the Columns area using the Aggregate dropdown list.
-
Apply facet values.
-
Use the Save button to save the analytic reports, which are listed under the My Analytics section of the component.
-
If you are an administrator or super user, saving the analytic enables the Publish Options button, which you can use to publish the analytic reports to the My Analytics section or the Tile repository of all users of the component.
-
If you are not an administrator or super user, saving the analytic report enables the Add to Homepage button, which you can use to add the analytic report to the fluid homepage.
-
Note:
The Create Analytics Wizard - step 3 does not display the editable facets. If you select a field that is used as an editable facet, that facet is displayed only when you view the analytic report.