Using the Actionable Chart Data Points
In a Chart Only model, clicking the chart data point enables you to drill down to the detailed view, drill to available dimensions, drill to a series, and perform related actions.
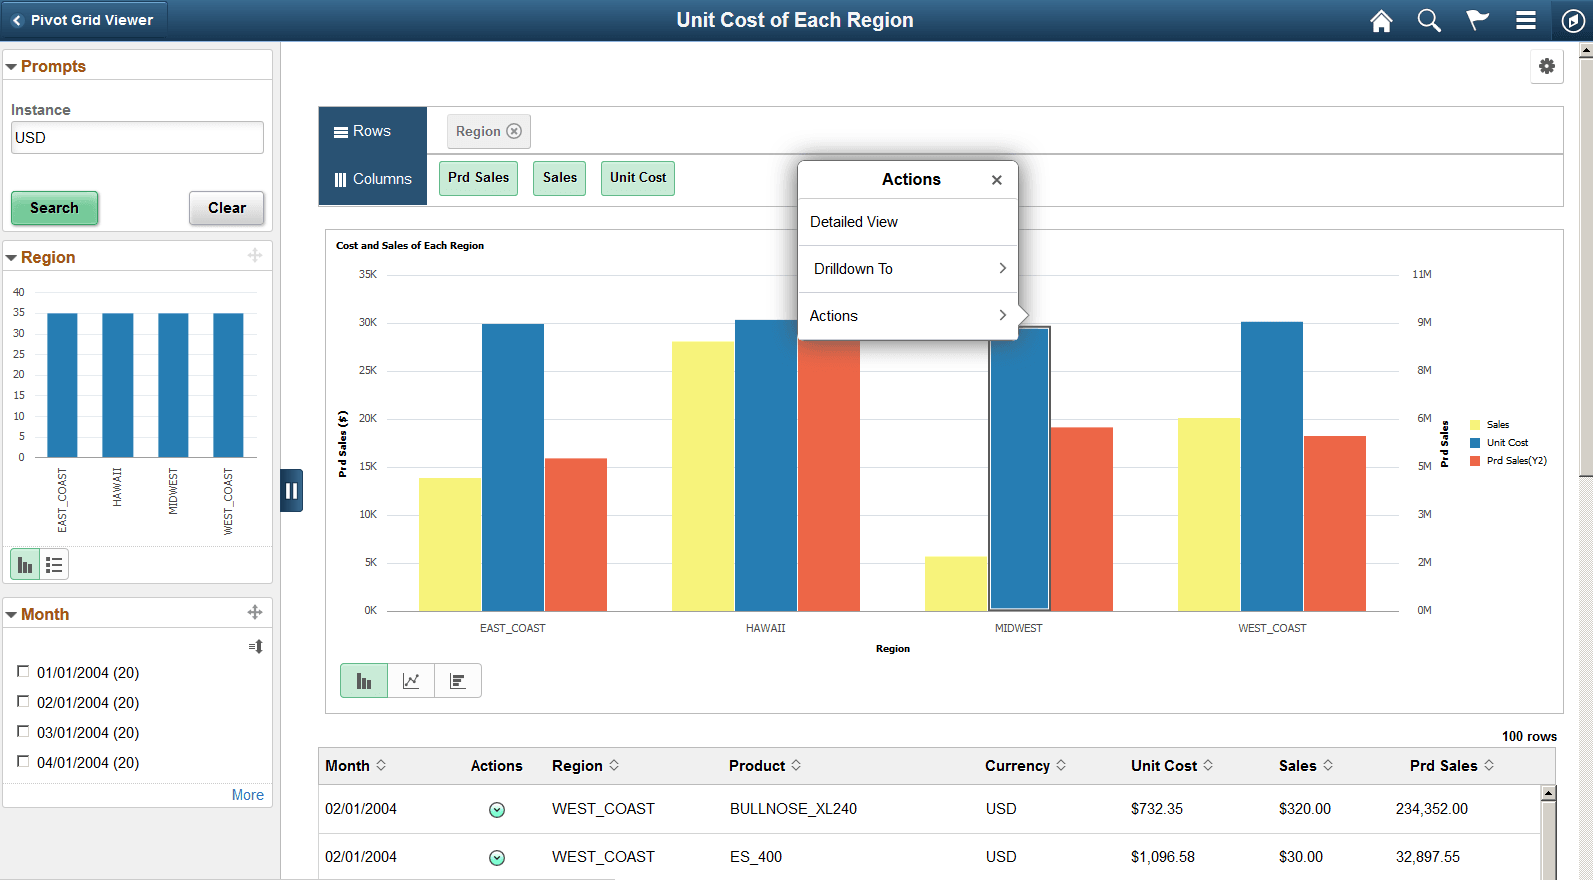
If the Pivot Grid model view is set to Chart Only, selecting the chart data point populates the menu that includes these options:
-
Detailed View
-
Selecting the Detailed View option displays the data that corresponds to the selected chart data point in the detailed view table below the chart. .
-
When you click on the chart area, outside any data point , the Detailed View returns to the original state, showing the complete chart view.
-
The Detailed View shows both grid and list view, if it is configured for the model in Fluid options. You can toggle between grid view and the list view.
-
-
Drilldown To
-
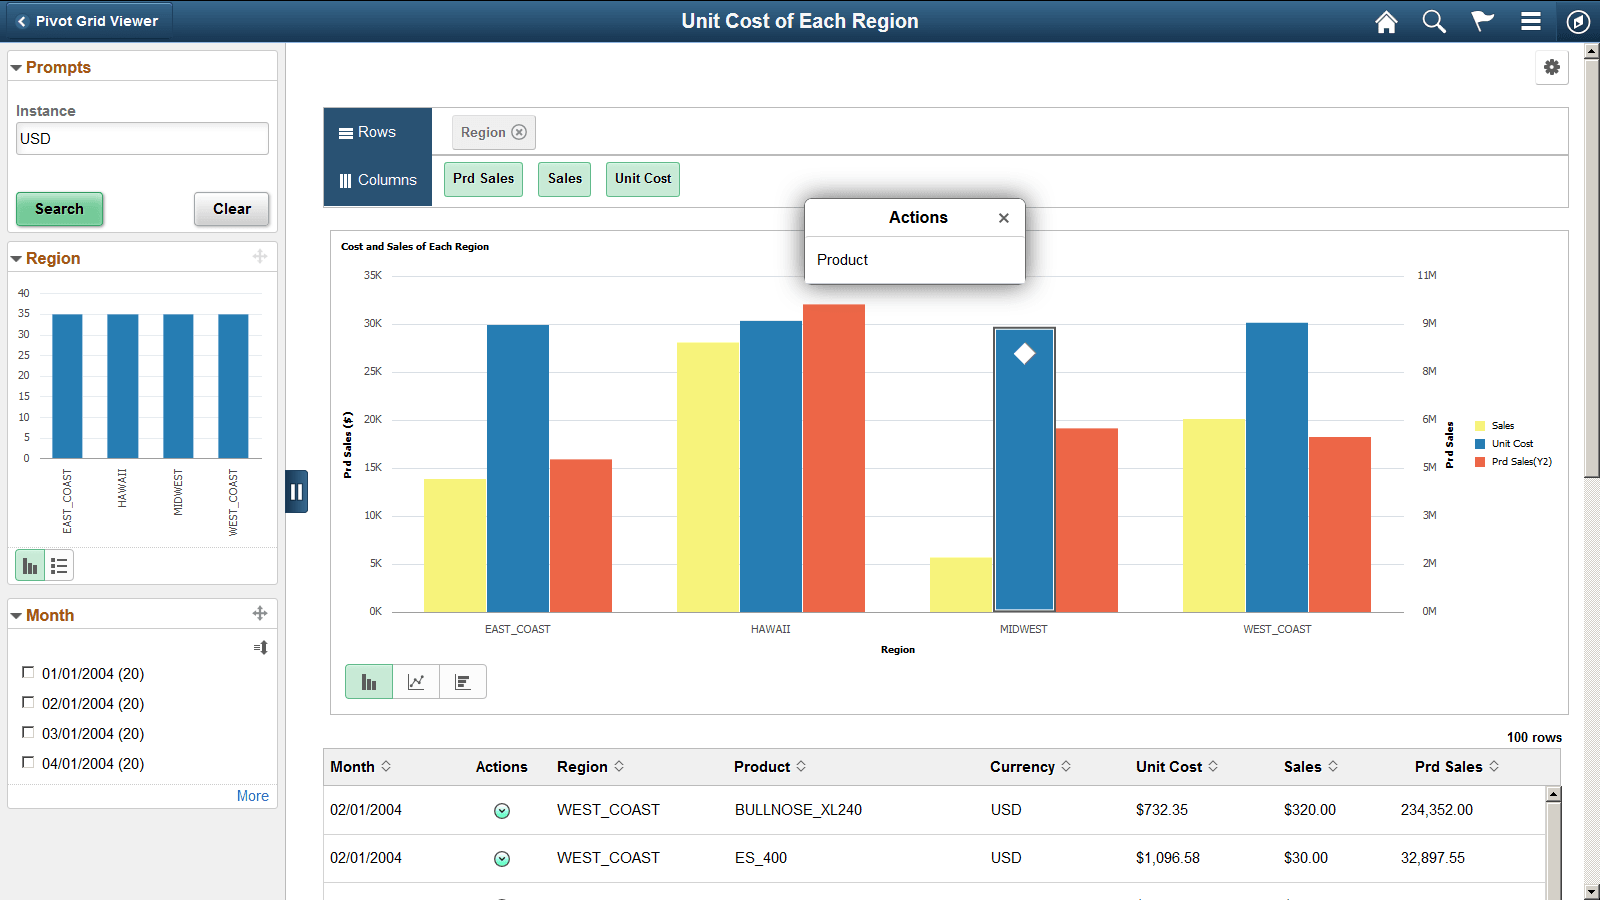
Select the Drilldown To option to display all available dimensions for the current chart data point. Note that when you drill down to a dimension, you set that dimension as the new X-axis on the chart and the existing X-axis value is added as a facet.
-
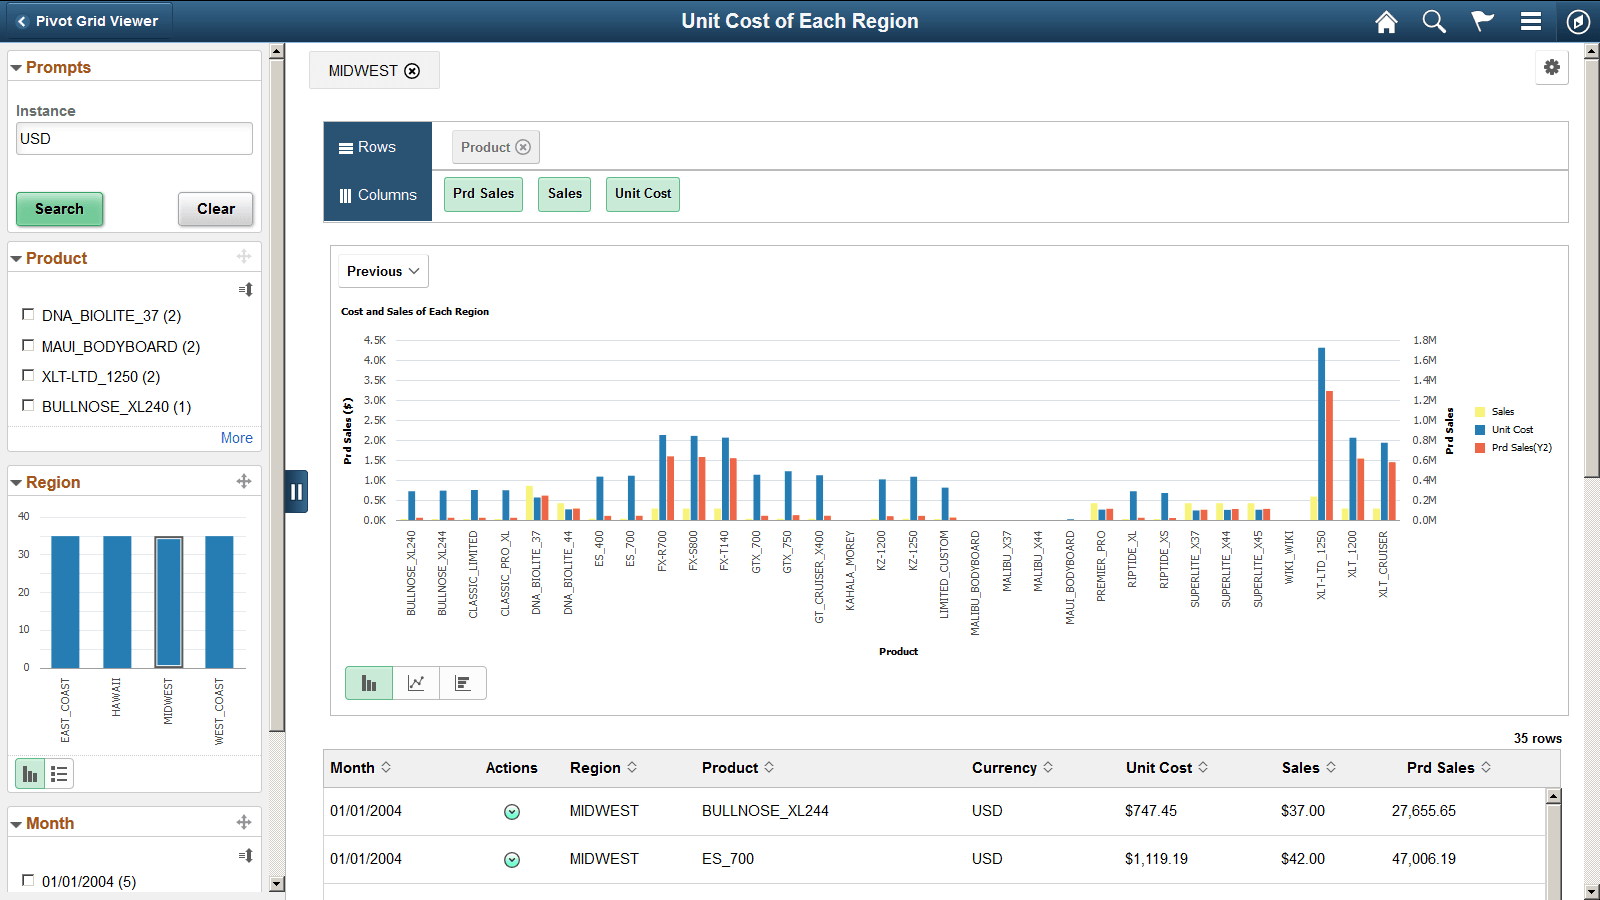
Select the Previous button, which appears on a drilled down chart view. It enables you to drill out to the initial view. These actions are similar to the classic Pivot Grid Viewer.
-
-
Drilldown Intersection To
Define a chart model with a dimension defined as series. When you click on a chart data point, the Actions menu displays the Drilldown Intersection To option. Select to drill down to series dimension. See Configuring a Series.
-
Actions
Selecting the Actions option displays the related actions configured on the model.
Note:
If there are no dimensions to drill down to and if there are no related actions configured on the model, then selecting a data point will not display the Actions menu but will display the detailed view corresponding to the data point.
Note:
To drill down on the chart, click the chart data points. To drill out on the chart, click the drill out link, which appears as a locator link at the top of the chart.
This example shows the chart menu after clicking the chart data point Unit Cost/MIDWEST on a Pivot Grid model that has the related action configured. The Region facet is set as a bar-chart facet. Sales, Unit Costs, and Prd Sales columns are set as Y-axes. Prd Sales column is also set as a dual Y axis.
This example shows the Drilldown To menu that lists the dimension(s) on which a drilldown can be performed. Note that Region is X axis, Sales and Unit Cost are Y axes, and Prd Sales is dual Y axis.
This example shows the Pivot Grid model after it is drilled down to Product, which is the new X axis on the chart. Product is also added to the facet area and the MIDWEST bar in the mini chart facet Region is highlighted. When you click the locator button (Previous) at the top left of the chart, a list of the previous dimensions appears enabling you to drill out to the previous selection.
Related Topics