Viewing the Server List
To access the Server List page, select
This example illustrates the fields and controls on the Process Monitor - Server List page. You can find definitions for the fields and controls later on this page.
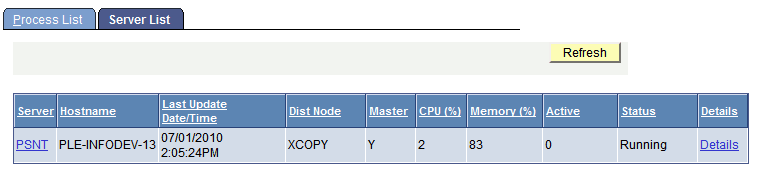
| Field or Control | Description |
|---|---|
|
Server |
Displays the system name that identifies the server. Click to view activity details for the selected server. |
|
Hostname |
Displays the name of server on which the PeopleSoft Process Scheduler Server Agent was started. |
|
Last Update Date/Time |
Displays the last time that you refreshed the server list to display the most current information. |
|
Dist Node (distribution node) |
Displays the name of the report node where the Distribution Agent posted all generated reports, logs, or trace files. |
|
Master |
Displays Y if this server is designated as a Master Scheduler. |
|
CPU (%) |
Displays current CPU usage as a percentage of the total. |
|
Memory (%) |
Displays current memory usage as a percentage of the total. |
|
Active |
Displays the number of processes that are currently in an active state of processing. |
|
Status |
Status of the server. Values are Running, Down, and Suspended. A complete list of Status values appears later in this section. |
|
Details |
Click to display detailed information about the selected server agent. |
|
Refresh |
Click to display the most current status of a server. |
Server Status
The Status column on the Server List page indicates the current state of a PeopleSoft Process Scheduler server. Knowing the status of a server helps you identify a problem if the server has an error. This table describes each server status:
| Status | Description |
|---|---|
|
Running |
Server is active and querying the process request for any queued request to schedule. |
|
Running With No Report Node |
The server has not been assigned a report node in the server definition, so reports with output destination of Web will remain in posting status until a report node is specified. Note: Server is active and querying the process request for any queued request to schedule. |
|
Down |
Server was shut down. |
|
Suspended - Disk Low |
Server determined that the current Log/Output directory is below the disk threshold specified in the Process Scheduler configuration file. The server will not schedule new requests until space becomes available. |
|
Suspended - Offline |
Server is suspended because current day and time is not within the allowed operation times defined in the server definition. |
|
Overload |
The amount of CPU or memory used exceeds the percentage value thresholds entered. The server will wait to launch any new processes. |
See Defining Servers.