Monitor Compute

This section explains the different methods and metrics you can use to monitor compute in your AI Data Platform.

View Spark UI

You can view the Spark Web UI to see to monitor the status and resource consumption of your all-purpose compute clusters.

  1. Navigate to your workspace and click Compute.
  2. Click your cluster, then click the Spark UI tab.
  3. Optional: Click to pop-out button on the top right to view the Spark UI in a separate window.

View Driver and Worker Logs

You can view the Driver and Worker Logs of your All Purpose Compute Clusters for troubleshooting or debugging.

  1. Navigate to your workspace and click Compute.
  2. Click your cluster, then click the Logs tab.
  3. Filter your logs to see more specific information.

    Log filters for Driver and Worker Logs, Cluster Note, Worker #, Log level, Time frame

  4. Click Download icon Download to save a local copy of your filtered data.

View Metrics

You can monitor the infrastructure metrics of your compute clusters for troubleshooting or for making any sizing adjustments.

You can view status and history for the following metrics:
  • CPU Utilization
  • Memory Utilization
  • Disk read
  • Disk write
  • File system utilization
  • Garbage Collector CPU utilization
  • Network received
  • Network transmitted
  • Active tasks
  • Total failed tasks
  • Total task tasks
  • Total completed tasks
  • Total number of tasks
  • Total shuffle read bytes
  • Total shuffle write bytes
  • Total task duration in seconds
  • SQL: Peak concurrent queries
  • SQL: Peak concurrent connections
  1. Navigate to your workspace and click Compute.
  2. Click your cluster, then click the Metrics tab.

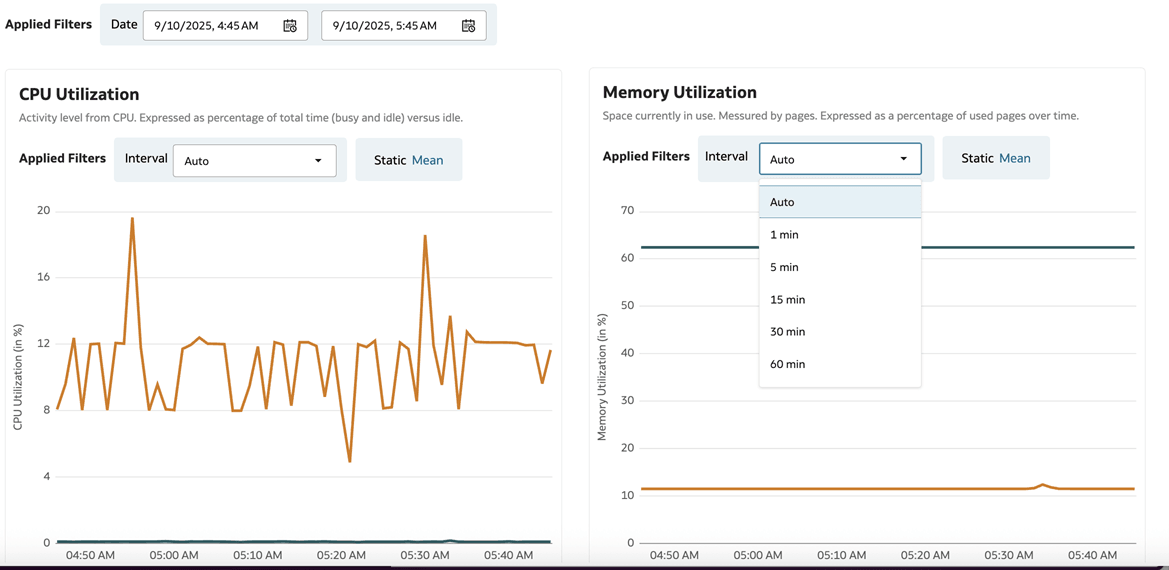
    Compute metrics tab open. The Interval dropdown for Memory Utilization is open with Auto selected.

  3. Select time frames using the Date filter to view metrics over a specific period.
  4. Select an option from the Interval dropdown to filter information for a specific metric.

View Event Logs

You can view the Event Logs to monitor different cluster related operations, like creation of clusters, restarts of clusters, init script execution, or monthly maintenance updates.

AI Data Platform retains the last 14 days of event logs.
  1. Navigate to your workspace and click Compute.
  2. Click your cluster, then click the Event Logs tab.
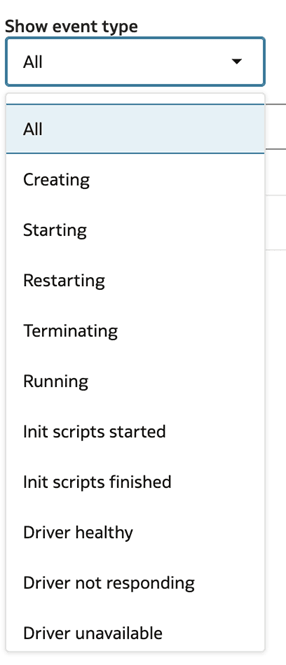
  3. Filter your logs to see more specific information.

    Show event type dropdown open with all options displayed

View Notebooks

You can view all the notebooks the current cluster is attached with. This view includes notebook count, notebook status, and provides you a quick way to navigate to the appropriate notebooks.

  1. Navigate to your workspace and click Compute.
  2. Click your cluster, then click the Notebooks tab.

    Compute page open with the Notebooks tab highlighted

    The notebook state is Active if code is running from that notebook. The notebook state is Idle if no code is running from that notebook.

  3. Click the name of a notebook to go to it.