Add a Second Layer to a Gantt Chart
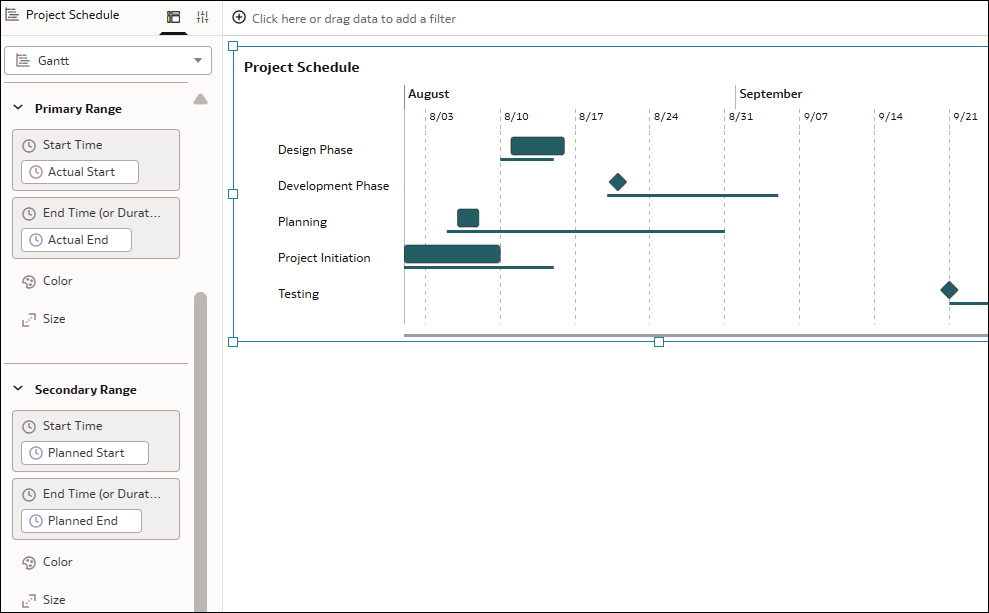
Add a secondary range to a Gantt chart when you want to show two layers of bars.
For example, you might want to compare the actual versus planned task duration for a project.
To add a secondary range, or layer, to your Gantt visualization, you need a separate set of start and end dates (or durations) for the column used in Category. For example, you can use columns called Actual Start and Actual End in the Primary Range layer, and columns called Planned Start and Planned End for the Secondary Range layer.
Oracle Analytics displays the thicker bars for the Primary Range on top and the thinner bars for the Secondary Range underneath.
Description of the illustration gantt_chart_add_second_layer.png
- On your home page, hover over a workbook, click Actions, then select Open.
- Click the Gantt visualization to select it.
- In the Data pane, drag the appropriate date column to Start Time under Secondary Range in the Grammar pane.
- Drag the appropriate date or measure column to End Time (or Duration) under Secondary Range in the Grammar pane.
- Click Save.