Change the Workbook Canvases Visualization Alignment
When you configure the presentation settings for a workbook, you can control where the visualizations are displayed on the workbook's canvases for consumers. This allows you to choose the best placement of the visualizations based on the consumer's screen size and resolution.
For example, if the workbook's canvases each contain one
visualization, then you can choose Center to add white space
around the visualizations to center them on the canvases.
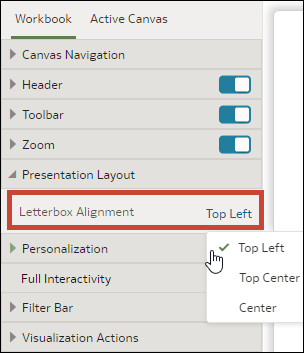
The alignment options are:
- Top Left - Adds white space to the right of the visualizations on the canvas, but not to the top and left of the canvas. This is the default.
- Top Center - Adds white space to the left and right of the visualizations on the canvas, but not to the top of the canvas.
- Center - Adds white space to the top, left, and right of the visualizations on the canvas.
You can also change the positions of the visualizations on a canvas. See Change a Visualization's Placement on a Canvas for Consumers.
- On your home page, hover over a workbook, click Actions, and select Open.
- From the Preview menu
 , select Configure Presentation.
 - Click the Workbook tab.
- In the Presentation Layout section, go to the Letterbox Alignment field and choose an alignment.
- Click Save.