Interact with Auto Insights to Focus on What You're Interested In
Auto Insights enable content authors to directly adjust the AI algorithms and focus them only on specific types of insights or specific columns from the dataset.
Auto Insights User Settings
- Select the insights type
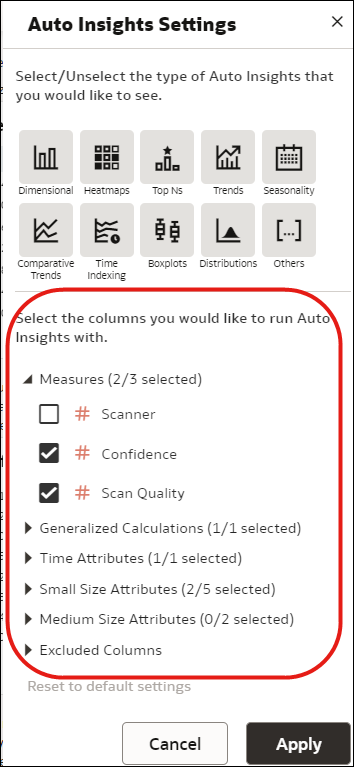
At the top of the Auto Insights Settings pane, you see a set of 10 icons listing the types of insights that Auto Insights can generate. Each of these types represents a specific type of analysis to conduct on your dataset. Select or deselect types of insights by clicking various icons and then clicking Apply. Auto Insights take this choice into account in the new run and only search for insights from the types you selected. By default, all possible types are selected.

Description of the illustration auto-insights-4.pngSome insights display only if specific columns exist in your dataset. Even if you've selected all the icons, they may still not be displayed because your dataset (or your selected columns) doesn't include the required column types. For example, time-related insights display only if a time column exists in your selection. As another example, heatmaps require at least two dimensions in their definition, so if only one dimension is present, no heatmaps are displayed.
- Select which column from the dataset to include in Auto
InsightsBy default, Auto Insights automatically identify which columns from your dataset deliver the most valuable insights. This initial column selection process is based on internal algorithms, but you can override the initial choice of columns and instead select specific columns to be used by Auto Insights. The Auto Insights visualization ranking algorithms can consume up to 11 distinct columns from any dataset at once:
- Measures - Up to three distinct measures can be used each time you run Auto Insights. If no metrics columns are selected, Auto Insights focus on insights counting records in your dataset.
- Generalized Calculations - This setting indicates that Auto Insights also calculate a row counter metric (counting the number of records) to find insights about. If you're not interested in seeing insights about counting the number of rows, deselect that option.
- Time Attributes - Only one time attribute is supported at a time when you run Auto Insights. Select one date type column in your data. If you have no time dimension selected, Auto Insights won't show the time-related insights type.
- Small Size Attributes - These are low cardinality attribute columns, that is, columns that hold a small number of distinct values, for example, less than 10 distinct values. These attributes are useful to represent high-level aggregated insights and analyses. You can select up to five of these attributes at once in a single Auto Insights run.
- Medium Size Attributes - These are attribute columns that hold up to a moderate number of distinct values, for example, up to 200 distinct values. These columns are useful to represent data in scatterplots or boxplots. You can select up to two of these attributes at once in a single Auto Insights run.
- Excluded Columns - These columns have been identified as not friendly for Auto Insights visualization types, for example: columns with very high cardinality, such as row ID, or columns with a very high proportion of empty values. If you represent these columns directly in visualizations, you might not be able to extract easily readable insights. Specific aggregation rules (count or count distinct) may also be a reason for a column to be excluded.
Look through the column settings and compose a meaningful selection of columns for your business case, then click Apply. The insight ranking artificial intelligence engine runs and quickly returns a series of insights ordered by their probability of showing interesting value. As you select more and more columns to include in the Auto Insights algorithm, you reduce the probability of seeing insights about all these columns at once. Only the top meaningful insights are shown in the panel, based on the algorithm's probability of interest. If you select many columns in the settings, it's unlikely that all of them will be part of the selected insights. On the contrary, if you select only a few columns, you increase the probability of seeing insights specifically for those columns in the panel.
The selection that you make for a given dataset remains in the system memory the next time you open that dataset, so you don't need to select the same objects all over again.
Custom Calculations and Other Column Limitations
Workbook custom calculations don't display as choices for Auto Insights selections. In order to run Auto Insights on a specific custom formula, you need to build the formula at the data-preparation level. That is, by editing the dataset definition in Oracle Analytics and adding a calculated column there. These custom calculated objects are then included in Auto Insights scoring, just like any other columns in the dataset.
Some column types aren't yet supported by Auto Insights, such as metrics with count or count distinct aggregation rules, or columns of the Geometries data type in Oracle Analytics.