Interpreting Results from a Similarity Analysis Model
When you run a data flow to perform similarity analysis, Oracle Analytics generates a dataset containing the results.
Here's what you can do:
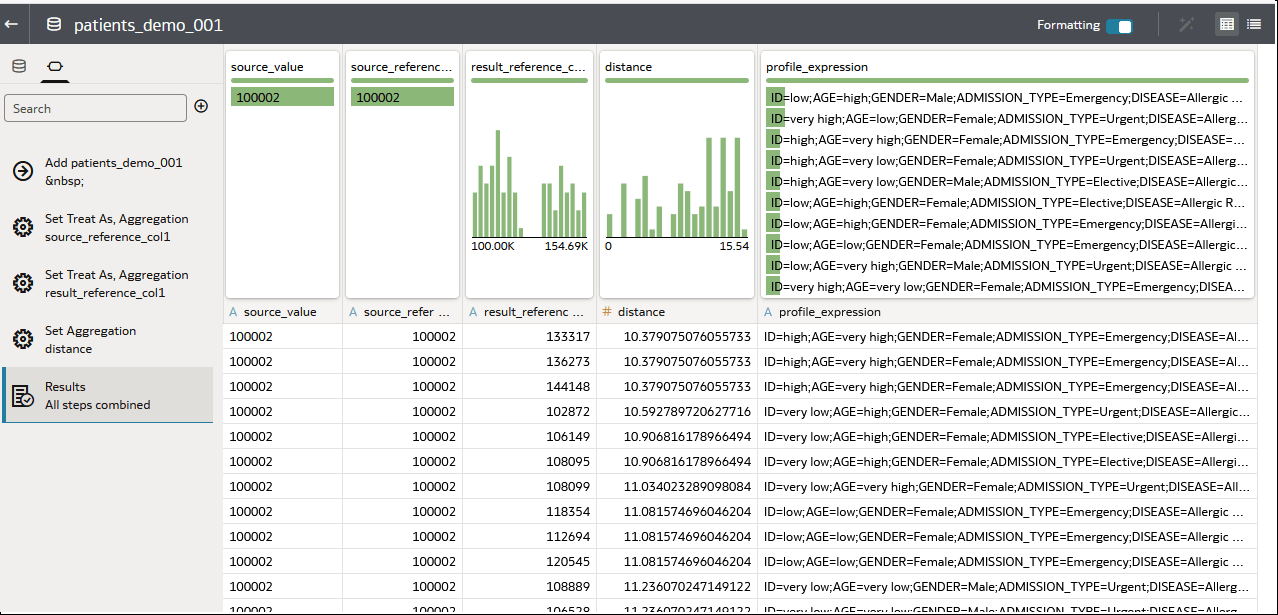
- Locate the output dataset on the Oracle Analytics Data page. Look for a dataset with the name specified in the Save Data step in the data flow. The dataset contains the same output columns listed in the Outputs section of the Similarity Analysis step in your data flow.
Dataset columns generated by the similarity analysis model:
- source_value - Returns the column with a single value within that column that was selected in the data flow as the source object. Your vector distance is measured by this value against all other values in this column.
- source_reference_column1 - Returns the selected value of the reference column (as set in the data flow node properties) for records that have been selected at source records for similarity analysis. This output will help you now what is the source record for which you have found the closest or furthest records.
- results_reference_column1, 2 and 3 - Returns the value of respective reference columns (as set in the data flow node properties) for records that have been identified as closest or furthest by similarity analysis.
- distance - The computed distance between your source value and the result record. That is, how similar or different is the data in source_reference_col1, source_reference_col2, and source_reference_col3 to result_reference1, result_reference2, and result_reference3.
- profile_expression - The concatenated expression of all columns used in your similarity analysis model into a single string. These are the columns for which values have been vectorized by the embedding model.
Note:
Attributes columns that you selected are part of the profile string, whereas measures in metric columns are first dynamically categorized into low, medium, and high bins so that they are properly represented in the vectors.
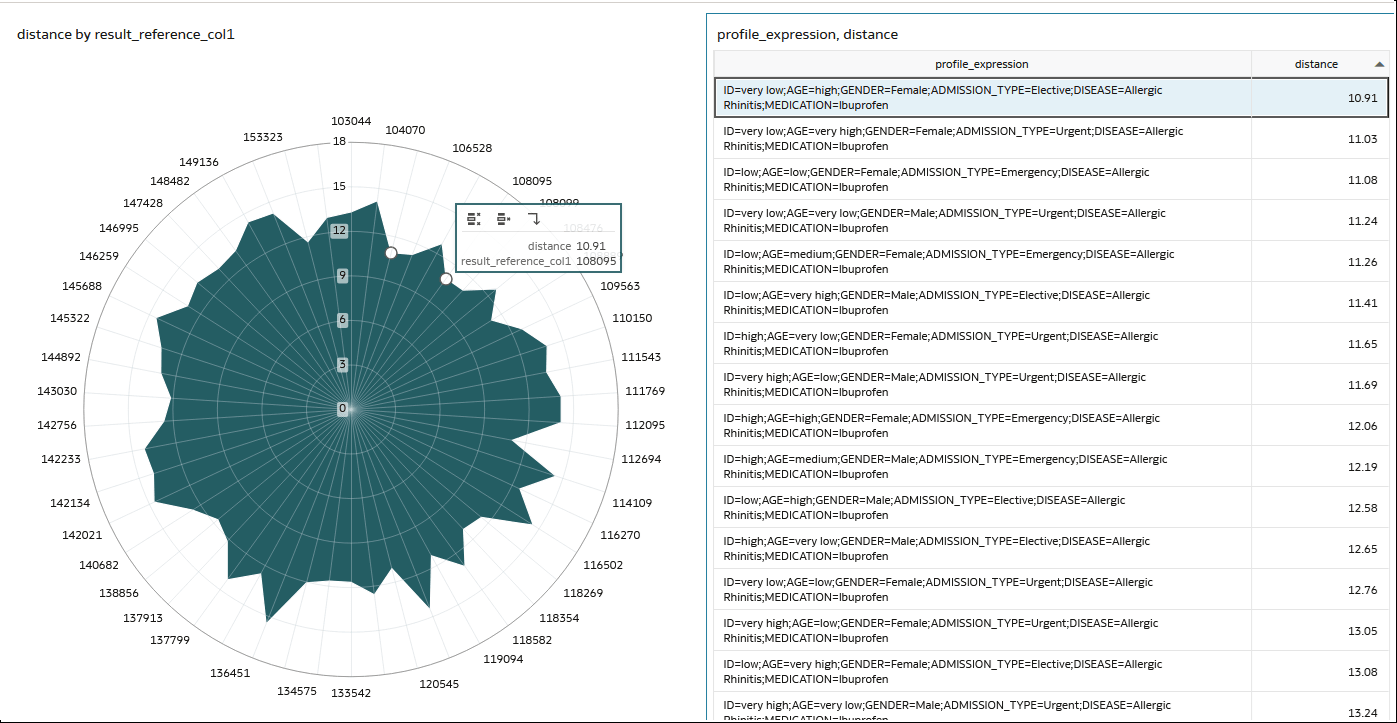
- Create a workbook based on the output dataset generated by your similarity analysis data flow.
- Create visualizations to analyze the results. For example:
Tip: For enhanced visualizations and insights, add the original dataset and join in to the model output data using the member ID. This provides you with an additional level of detail in measuring the vector distance to some of the original dataset attributes.

