Modify the Layout of Data in Views
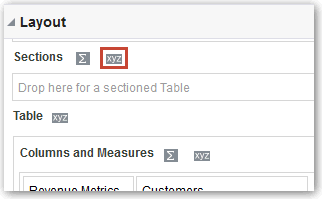
Use the Layout pane to modify the way that data is arranged in a view.
Perform tasks such as adding and rearranging columns and adding totals.
Topics:
Add and Rearrange Columns in Views
You can add and rearrange columns in views.
Topics
Add Columns to Views
This topic explains how to add a column to a view.
- Drag the column from the Subject Areas pane to the appropriate location in the view editor.
- Drag the column from the Subject Areas pane and drop it on a drop target on the Layout pane of the view's editor.
Remove Columns from Views
You can remove columns from views.
Removing a column from a particular view doesn’t remove it from the underlying analysis or remove it from other views. If you want to remove the column from the analysis and all views, remove it using the Criteria tab.
- Open the view for editing.
- In the Columns and Measures section of the Layout pane, click More Options.
- Select Remove Column.
Rearrange Columns in Views
You can rearrange columns in views.
To rearrange columns in the Layout pane:
-
Open the view for editing.
-
In the Layout pane, drag and drop the column to the required location.
This procedure provides the most basic steps for using the Layout pane to rearrange columns. Many options are available for arranging columns in the Layout pane. See About Drop Targets in the Layout Pane.
Set Properties for Sections of Data in Views
You can specify properties for the view body (such as a pivot table) or drop target (such as a section).
For example, you can set the background color to light green and insert a page break in a long table of revenue values.
Add Totals to Tables and Pivot Tables
In the Layout pane, you can add column totals in tables and pivot tables.
You can position the totals at various locations in the view. You can add totals for columns that are displayed on the various edges. For each measure, the total uses the aggregation rule for that measure.
If you specify a total in the Rows or Columns drop target of a pivot table, then the totals that are displayed are the result of the columns that are specified in the Measures drop target. Total values aren’t displayed on the Columns or Rows edges of the pivot table but rather in the data in the center of the pivot table.
Display Running Sums and Relative Values in Pivot Tables
You can use the Layout pane to display running sums or the relative value of measure columns in pivot tables.
Topics
Display Running Sums for Measure Columns in Pivot Tables
In a pivot table, you can display numeric measures as running sums, where each consecutive cell for the measure displays the total of all previous cells for that measure. This option is a display feature only that has no effect on actual pivot table results.
Typically, running sums are displayed for duplicated attribute columns or for measure columns for which the option to show data as a percentage of the column has been selected, with the last value being 100 percent. For example, you can display a running sum and percentage, to view progress toward next year's revenue target of $2 million. Running sums apply to all totals. The running sum for each level of detail is computed separately.
Column headings aren’t affected when the running sum option is selected. You can format the column heading if you want it to indicate that the running sum option is in effect.
The following usage rules are in effect for running sums:
-
A running sum is incompatible with the SQL RSUM function (the effect would be a running sum of the running sum).
-
All running sums are reset with each new section. A running sum doesn’t reset at a break within a section or continued across sections.
-
If a measure doesn’t display in a single column or in a single row, then the measure is summed left to right and then top to bottom. (The lower right cell contains the grand total.) A running sum doesn’t reset with each row or column.
- Open the pivot table view in the view editor.
- In the Layout pane, in the Measures area, click More Options for the row or column to be summed.
- Select Display as Running Sum.
Display Relative Values for Measure Columns in Pivot Tables
In a pivot table, you can dynamically convert a stored or calculated measure into a percent or an index.
This shows the relative value of the item, compared to the total, without the need to explicitly create a calculated item for it. You can view the measure as a percentage between 0.00 and 100.00, or as an index between 0 and 1.
For example, if you’re using a pivot table to examine sales by product, then you can duplicate the sales measure and view it as a percentage of the total. This enables you to see the actual sales, and the percentage of sales, that each product accounts for.


